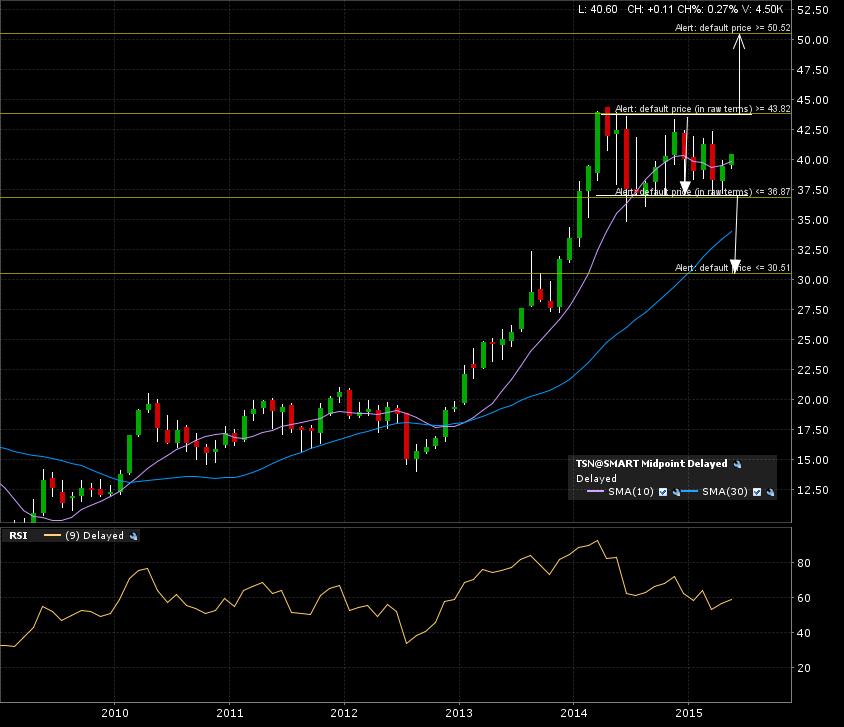
Is Tyson Foods Inc. (TSN:NYSE) tracing out a top formation OR a bullish continuation pattern? I have scenarios for BOTH possibilities. Check out the monthly candle chart with the implied measured move added to either break lines.
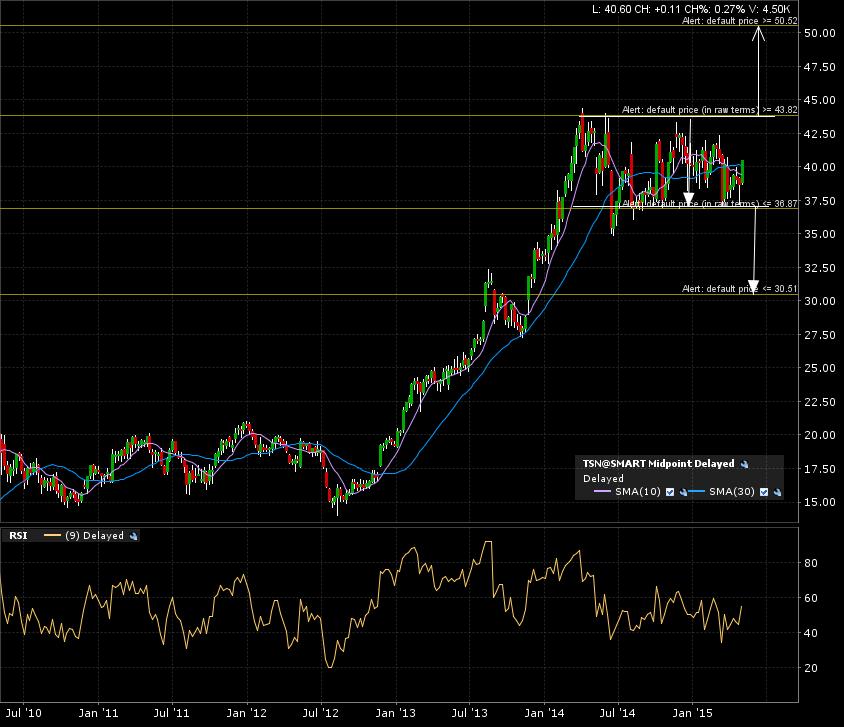
The 5 year weekly candle chart shows more of the same, with some noise below the breakdown line.
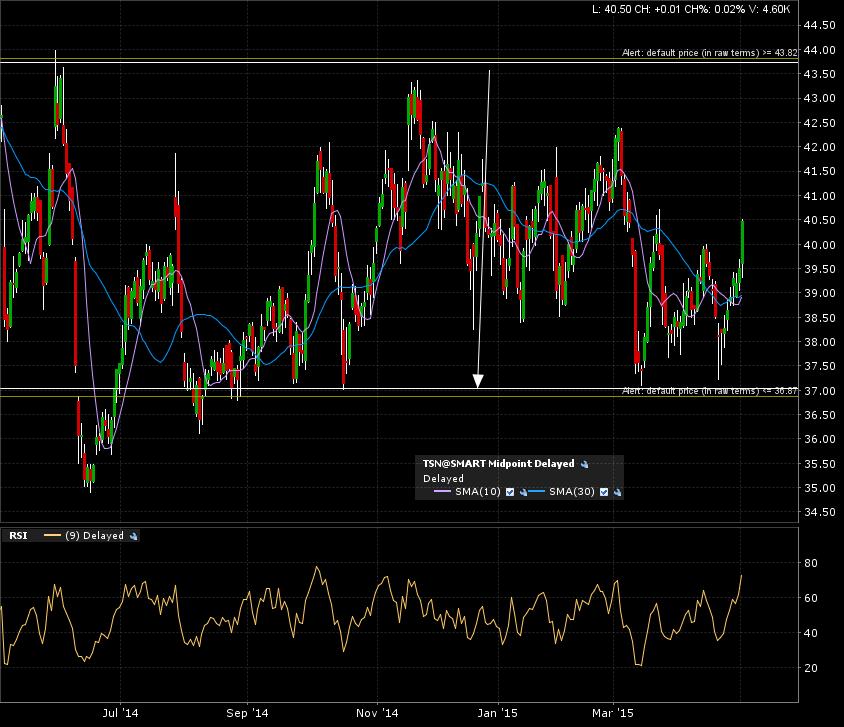
Zoom in on the 1 year daily candle chart. After a bounce on the breakdown line (support) the price action is right now in no man’s land.
My alerts are set. One at 43.80 and the other at 36.80. A convincing monthly candle close beyond either of the levels would confirm the next target. Bearish target at 30.50. Bullish target at 50.50.
Now the waiting game starts. Be patient.