The NZDCHF forex currency pair is carving out a BIG top formation. Check out the monthly candle chart. The target also coincides with a WALL.
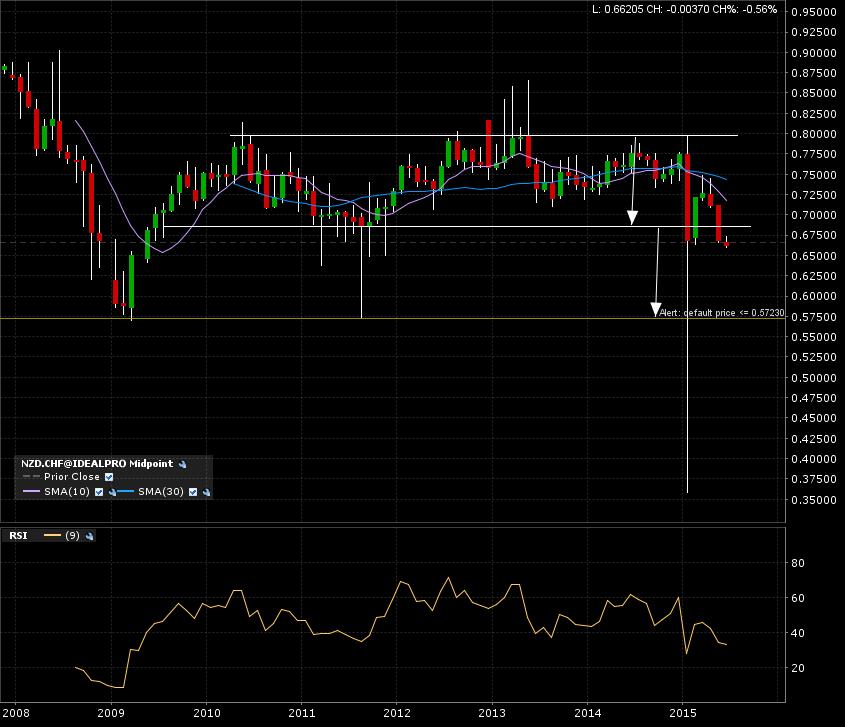
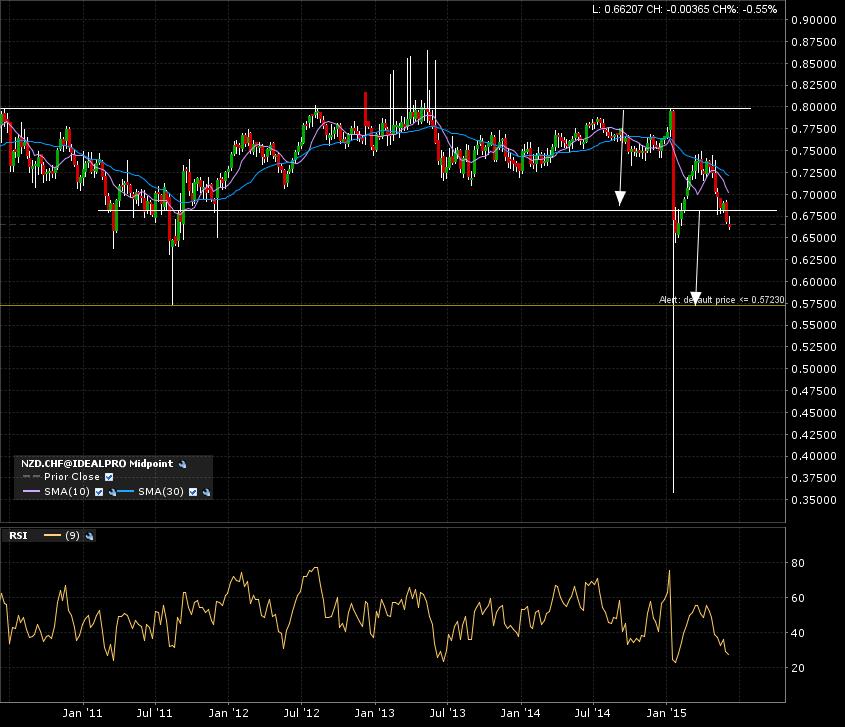
Here is the 5 year weekly candle chart. Some noise below the breakdown line. You can see the previous failed breakdowns below the 0.68 mark.
The 1 year daily candle chart zoom shows the price action closing in on a test of the previous failed breakdown.
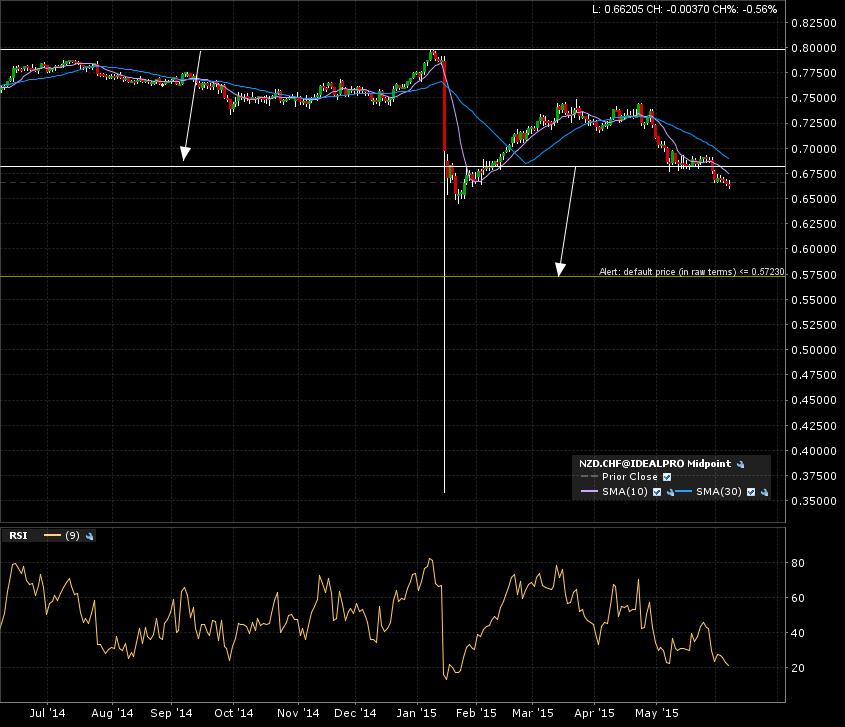
If we remain below the breakdown line by months end, this would confirm a target of 0.5750