Broadcom Corp. (BRCM:NASDAQ) is approaching the breakout line of a HUGE “ascending triangle” continuation classical chart pattern. The bigger the base, the higher in space! Check out the 10 year monthly candle chart.

The 5 year weekly candle chart shows some consolidation close to the breakout line at 47.50.
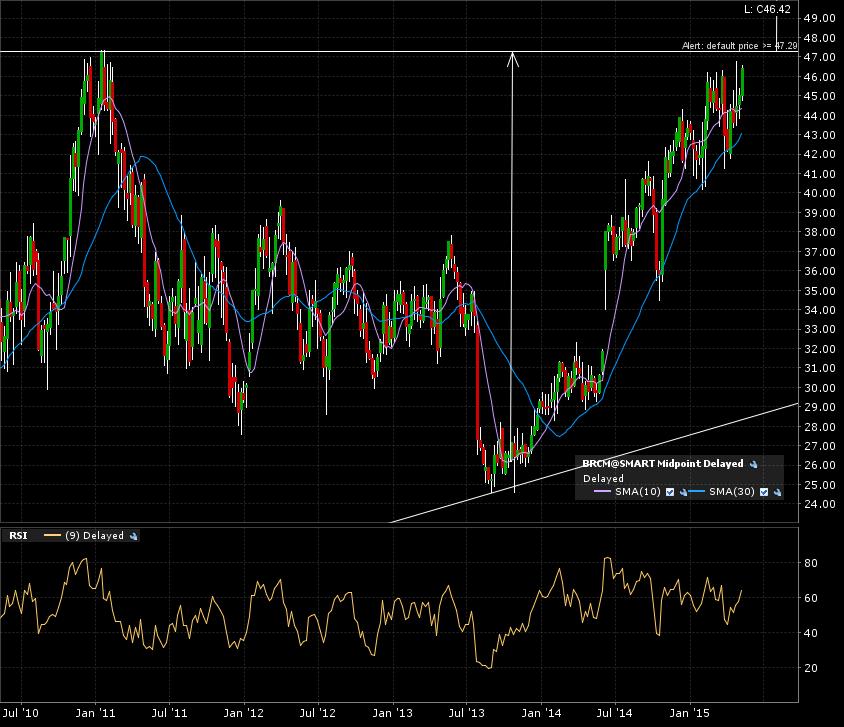
Zoom in on the 1 year daily candle chart and you can see the price action testing multiple times the breakout area.
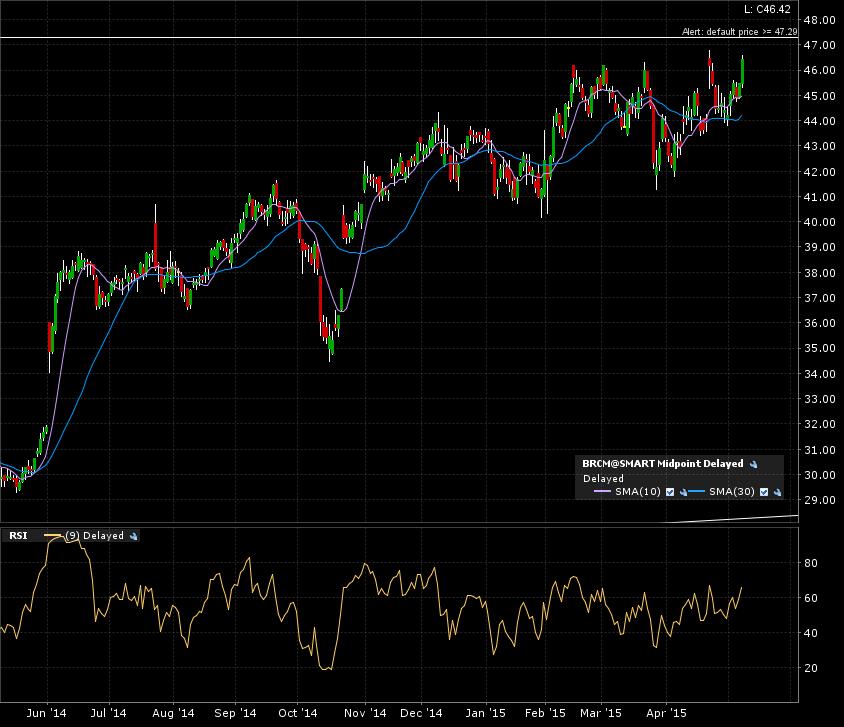
I set an alert at 47.50. A monthly candle close above that level will confirm the target of 69.