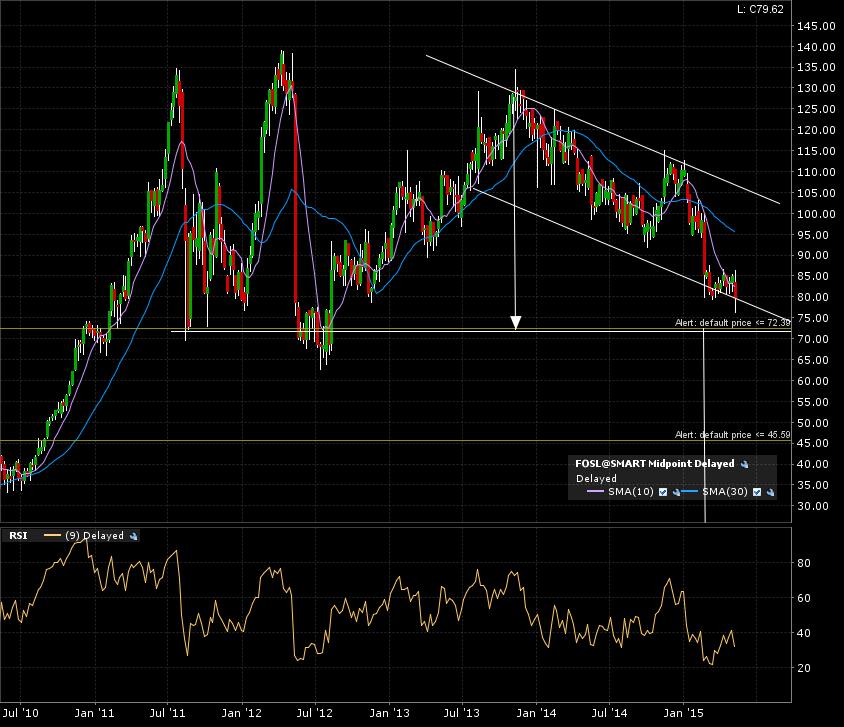
Fossil, Inc. (FOSL:NASDAQ) is in progress of tracing out a HUGE top formation. Currently in a “descending channel” on it’s way to test the breakdown line. Check out the 10 year monthly candle chart. Target is 17.50 IF a monthly candle close can happen below the 70 mark. Watch out for the “WALL” at the 45.50 level. That is resistance turned support after a previous breakout.

Here is the 5 year weekly candle chart. Close to testing the breakdown line at 70.
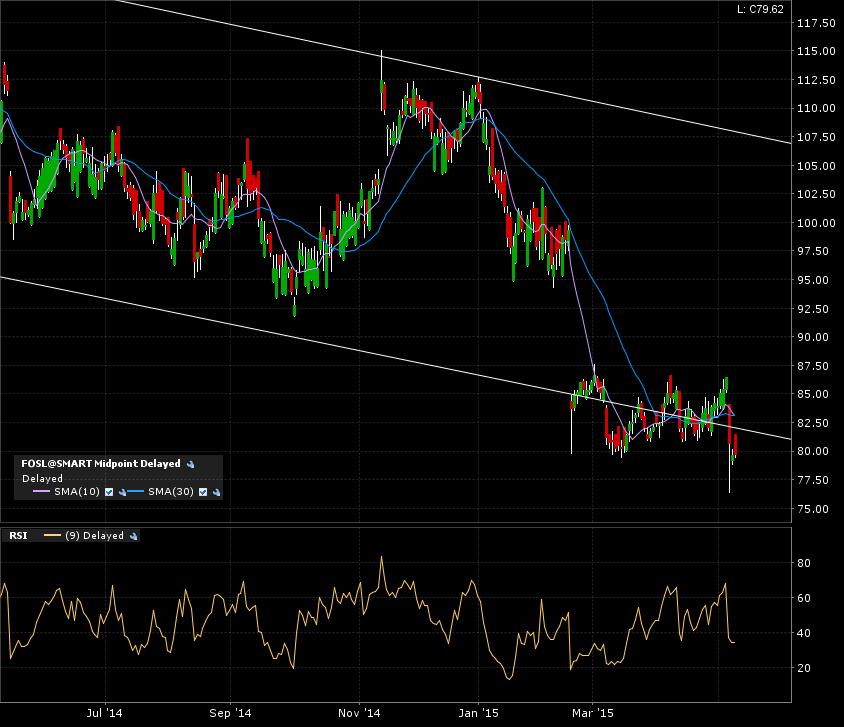
Zoom in on the 1 year daily candle chart. Price action playing around the lower boundary of the “descending channel” classical chart pattern.
My alerts are set. The most probable target after a confirmed breakdown is the “WALL” target at 45.50. The less probable is the full measured move added to the breakdown line at 17.50.