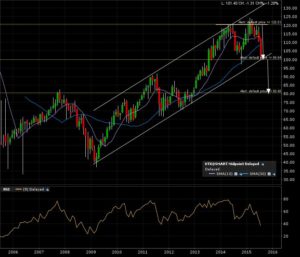
I wrote a post on Jan 21 envisioning a bullish breakout. The breakout never occurred and a reversal has brought us down to the breakdown line. Check the previous post here. The monthly candle chart shows us the breakdown line at 100. This also coincides with the ascending channel support line.
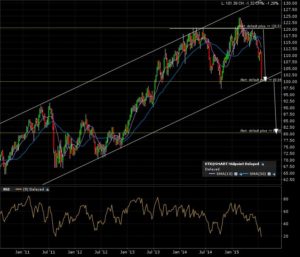
The 5 year weekly candle chart shows the top formation being traced out.
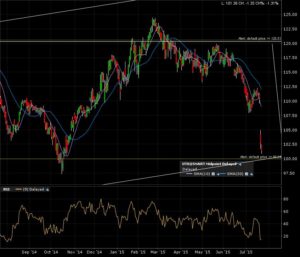
A final zoom on the 1 year daily candle chart. Gap down all the way to test the breakdown line.
Again, NOBODY knows the future. Bullish breakout OR bearish breakdown, I’m ready for BOTH.


