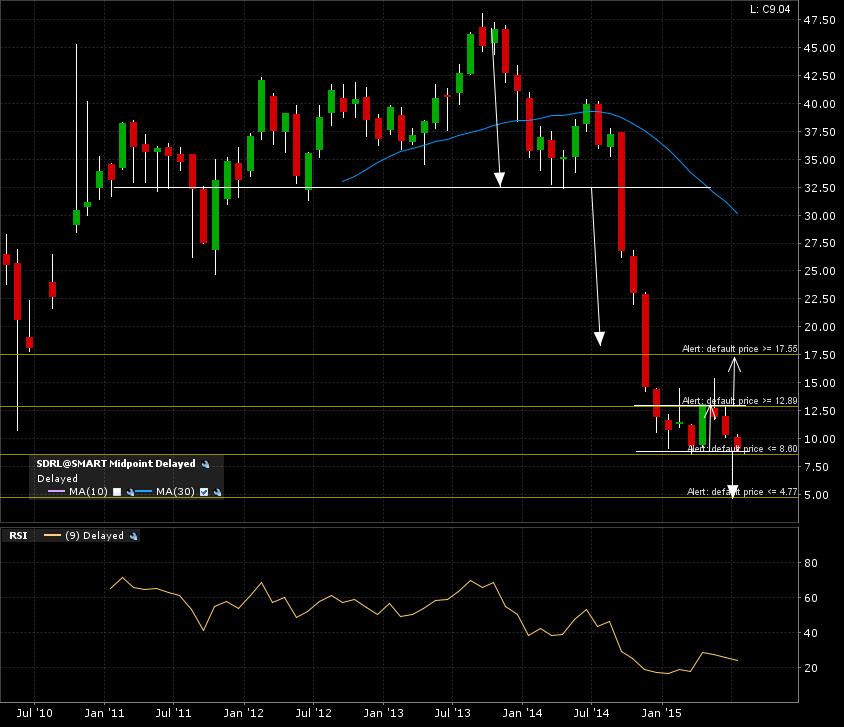
SeaDrill Limited (SDRL:NYSE) has deep dived and hit a possible bottom. Check out the monthly candle chart. After going thorugh a WALL (check the link to a previous post) at 27 and hitting the furthest target at 18, a 7 month consolidation pattern is in the works.
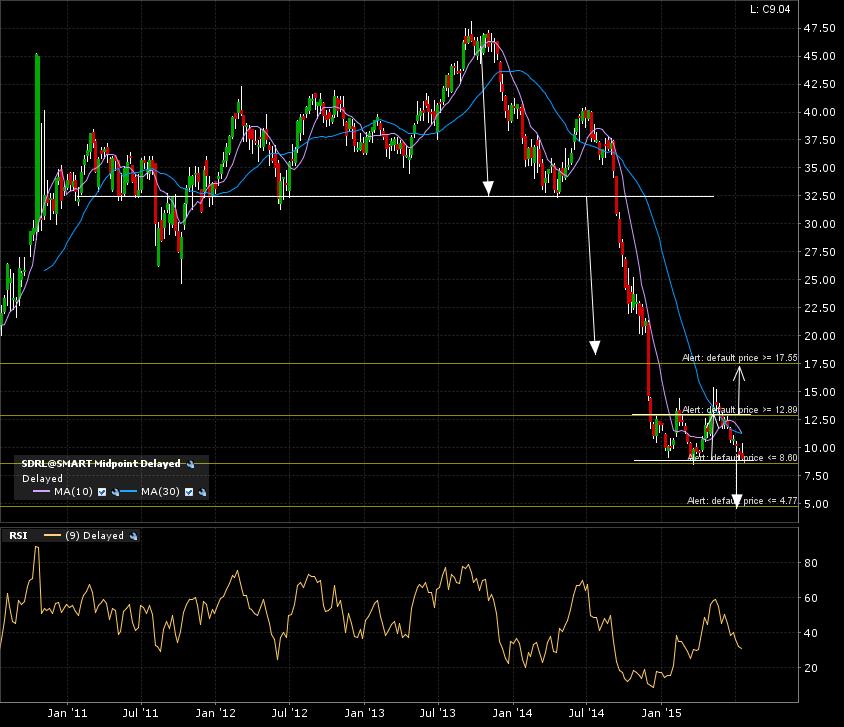
Here is the 5 year weekly candle chart. Two possible scenarios, a bullish breakout at the 13 (resistance) line OR a bearish breakdown at the 8.5 (support) line. Ensuing targets would be 17.5 OR 4 respectively.
Zoom in on the 1 year daily candle chart. Some noise (check the link to a previous post) above the breakout line.
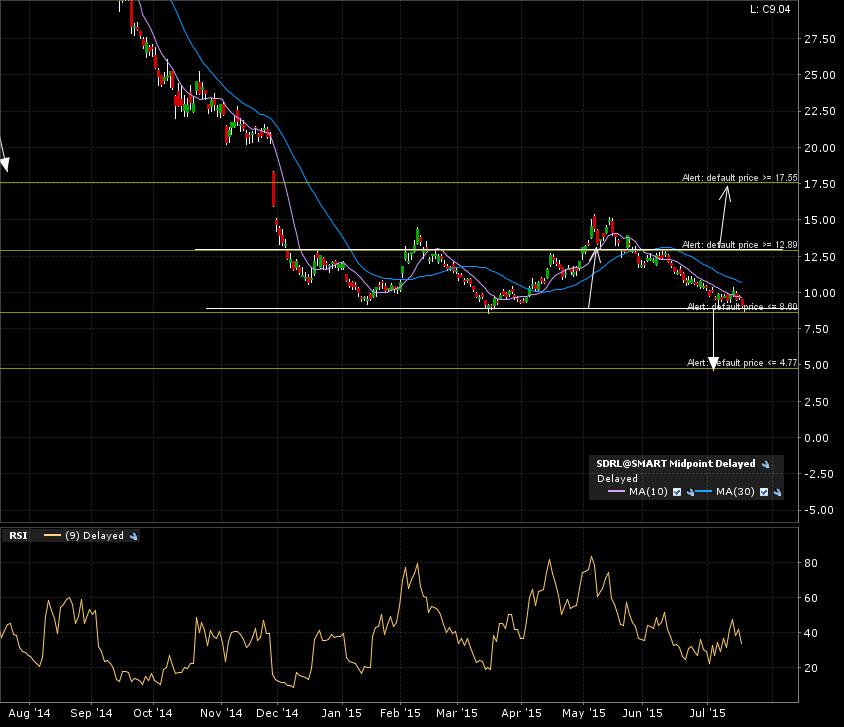
My alerts are set. Will come back to this once trigerred. Remember, a monthly candle close is required to confirm the next move. Hold your breath, still very deep under water!