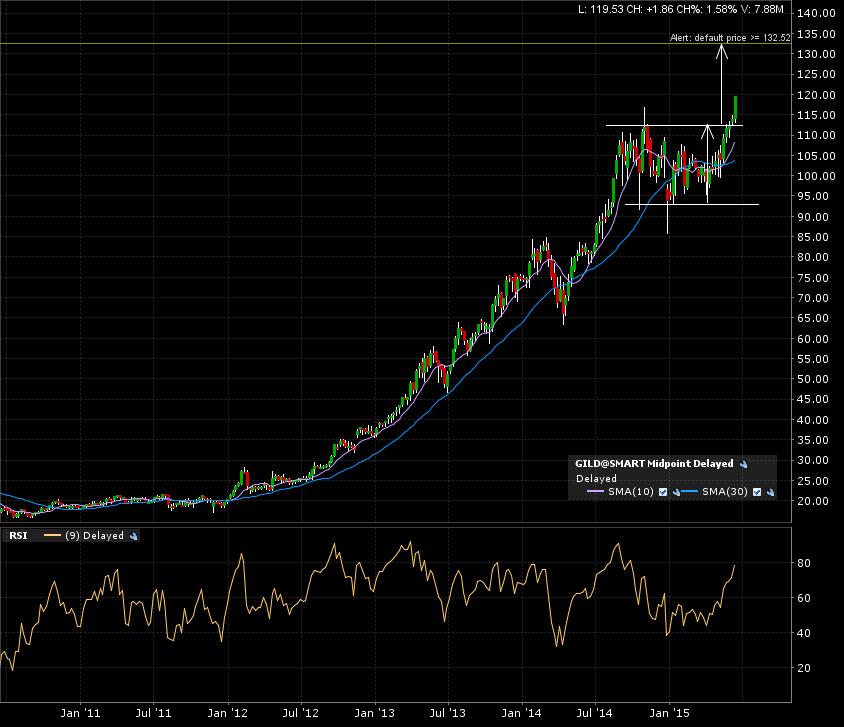
Gilead Sciences Inc. (GILD:NYSE) just resolved a 1 year continuation pattern, on it’s way to the 132.50 target. Check out the 10 year monthly candle chart.

The 5 year weekly candle chart shows the breakout in progress. More of the same.
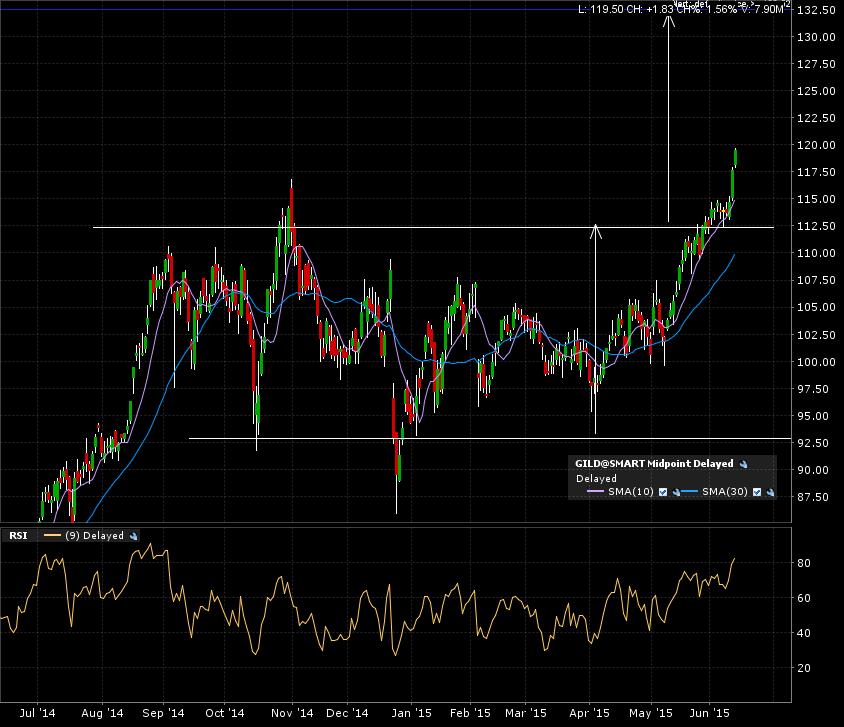
Zoom in on the 1 year daily candle chart. We seen the breakout, retest a few days later, and the final get away.
If the monthly candle close can stay above the breakout line of 112, it’s full steam ahead towards the target.