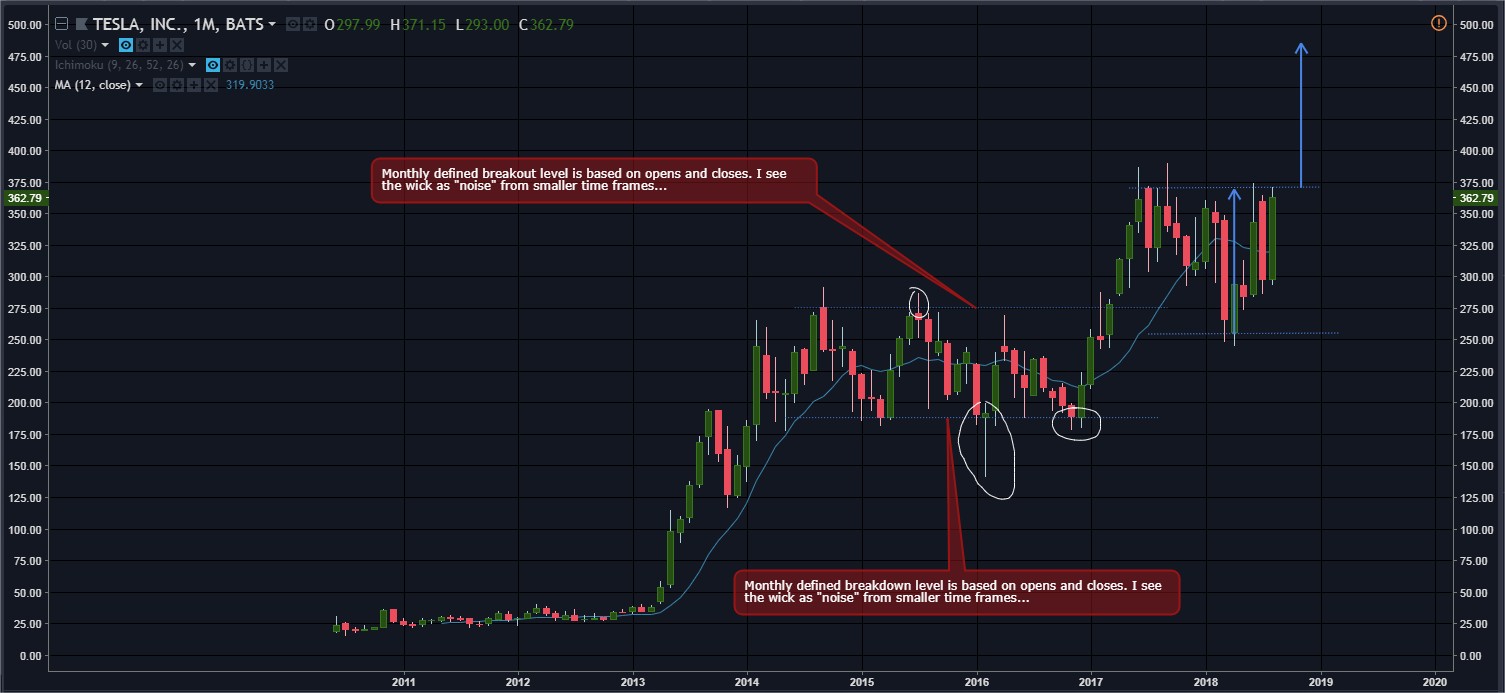
Definition of my important concept of “hidden resistance” and “hidden support”:
1- Resistance (support) defined on the next higher time frame using open and closes as bounderies.
2- The higher the time frame, the more weight (value) that resistance (support) has.
Here is an example using Tesla. Let’s say you are using weekly time frame to trade. First thing to do is go to next larger time frame, in this case monthly chart. Draw your resistance and support lines using the opens and closes of the candles. This excludes what I call “noise”, which is price action from smaller time frames expressed in the wicks.
Now, go back to your weekly time frame. Notice the price action above and below the monthly defined break lines. Those are potentially avoided whipsaws and false breakouts. The price action sunk through the higher trend’s more important bounderies, only to have it sucked back in, within the higher time frame’s range.
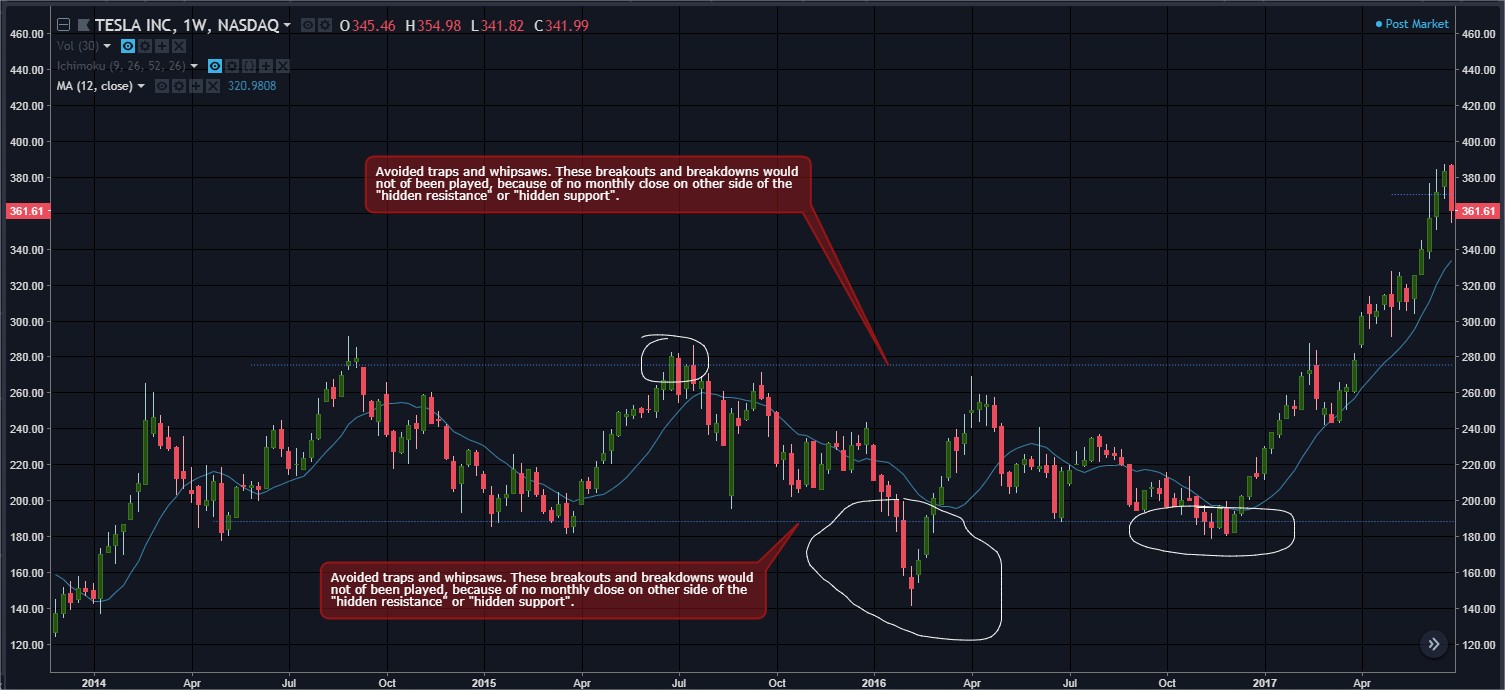
I always look for a reason not to enter a trade. This IS my go to! If I don’t get a close on the good side of this “hidden resistance” or “hidden support”, I’m better off staying on the sidelines.