Rackspace Hosting, Inc has hit it’s breakout bullish line. There are two possible scenarios for Rackspace (RAX:NYSE).
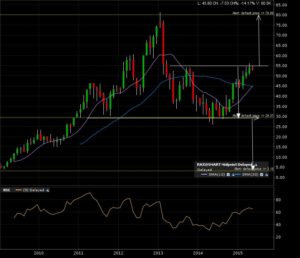
Check out the monthly candle chart. The arrows indicated the implied measured move added to the breakout or breakdown lines.
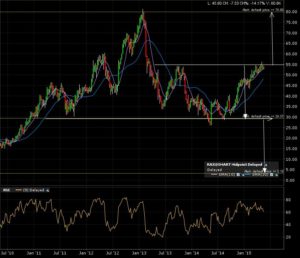
The 5 year weekly candle chart shows the price action hitting the resistance line.
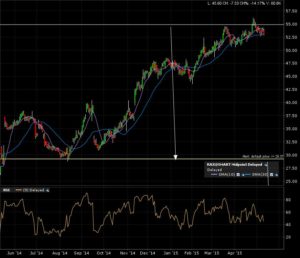
Zoom in on the 1 year daily candle chart. More of the same with the price touching the breakout line.
I have set my alerts for BOTH possible scenarios. A monthly candle close above 55 will give me a target of 80. A monthly candle close below 30 will give me a target of 5.
Let’s wait and see where this goes.


