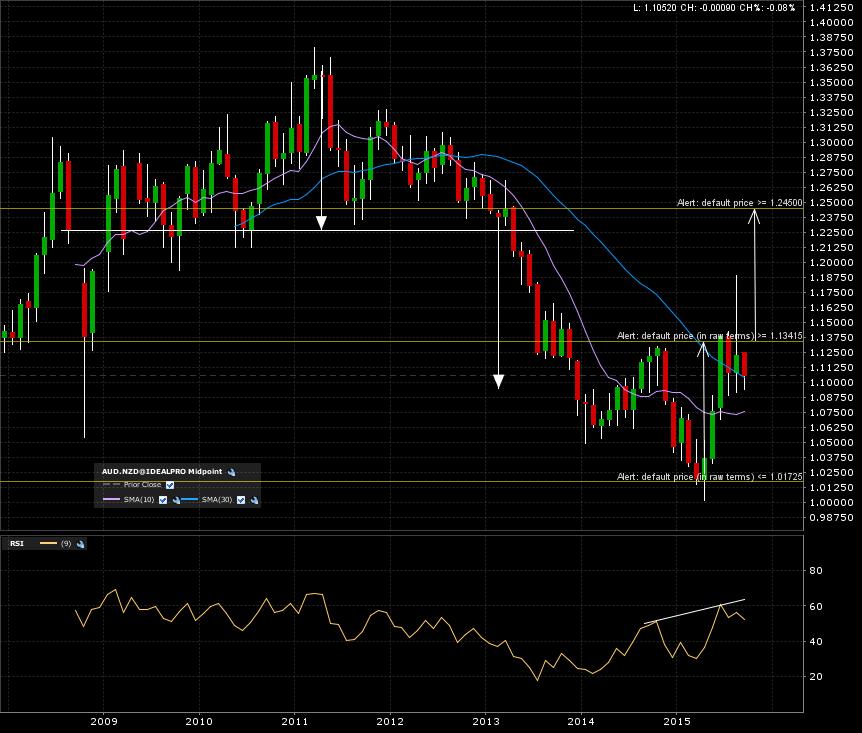
The audnzd forex pair is morphing into a +2 year base pattern after hitting it’s target from the previous top +4 year formation. Here is the 10 year monthly candle chart. A close above 1.14 and the ensuing target is 1.2450, back to the previous breakdown line. That is also what I refer to as a “WALL”, support now turned resistance. Check this post on my concept of “WALLs“.
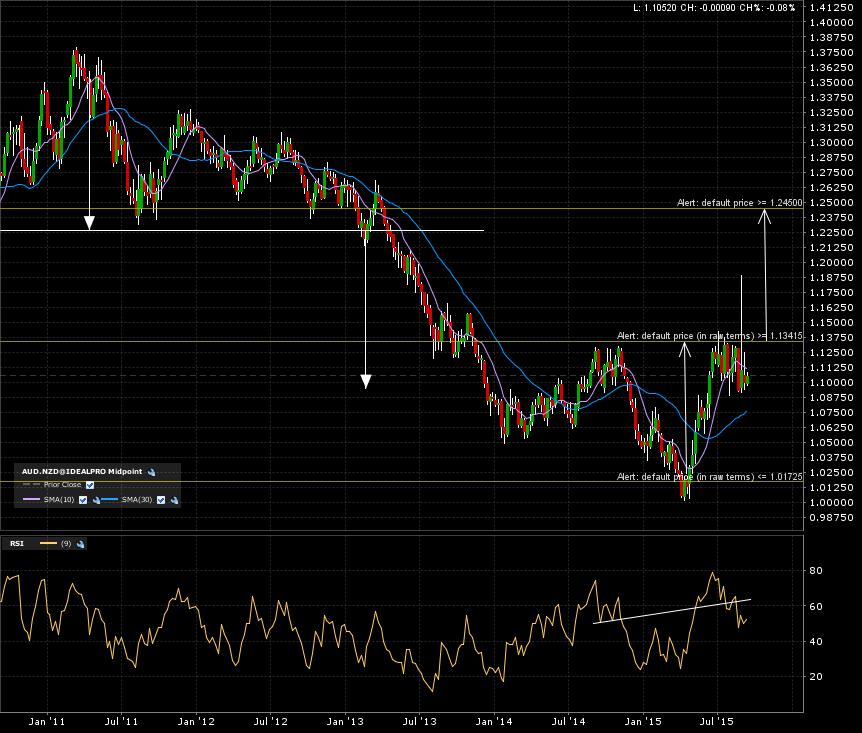
Here is the 5 year weekly candle chart. More of the same.
The final zoom in on the 1 year daily candle chart. Price action testing the breakout line.
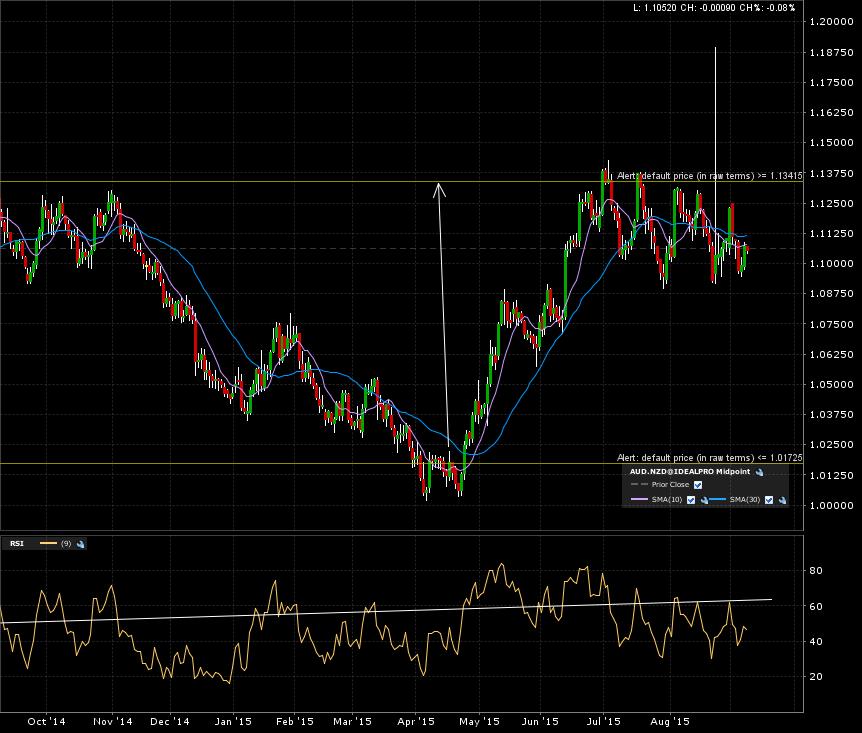
I set my alerts and will come back to this when triggered. Again, patience required!