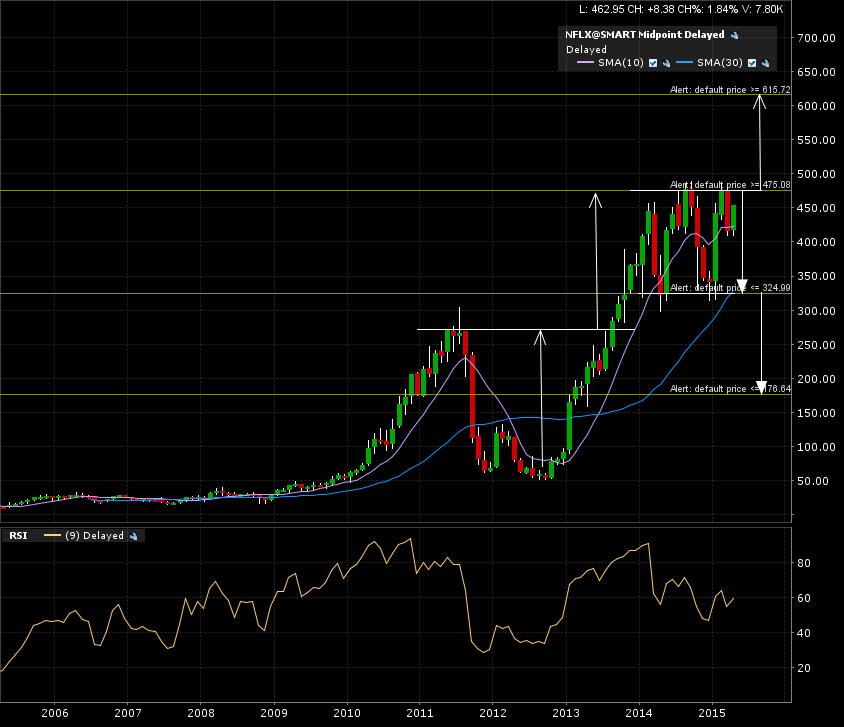
Netflix Inc. (NFLX:NASDAQ) has been consolidating +1.5 years on the monthly candle chart after reaching it’s previous target from the 3 year base breakout. Check out the 10 year monthly candle chart. The arrows are the implied measured moves added to break lines for either the next bullish OR bearish move.
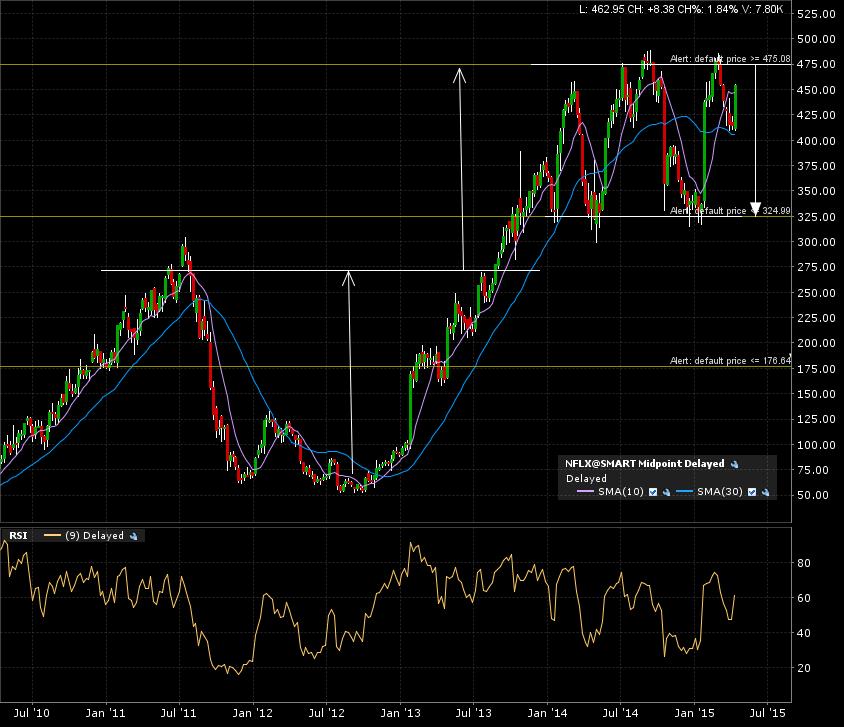
The 5 year weekly candle chart shows the price action closing in on another test of the breakout line (resistance).
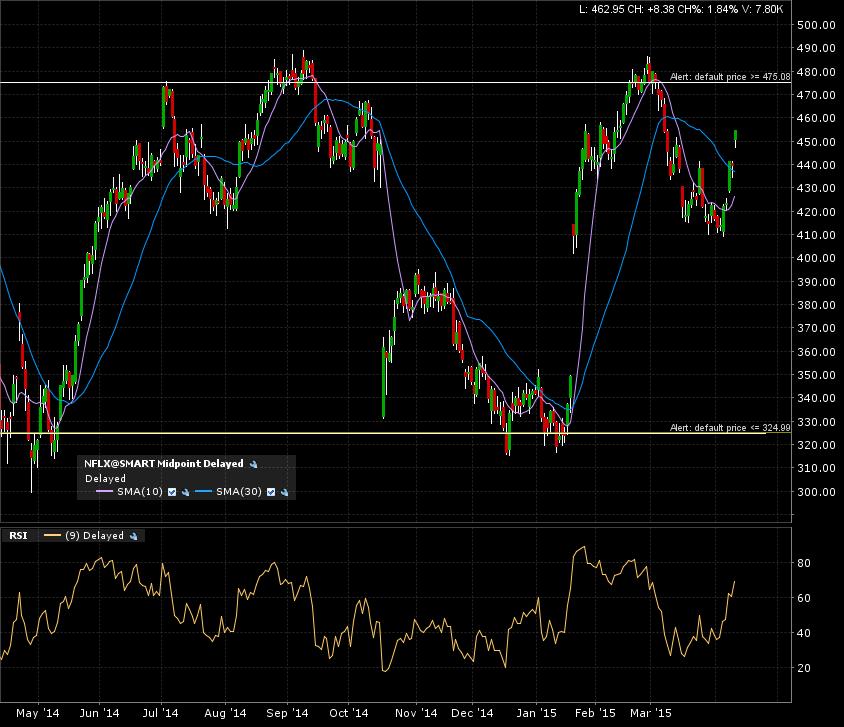
Zoom in on the 1 year daily candle chart. Lots of noise.
Right now, a bullish continuation move is in the cards. The moving averages on the monthly candle chart haven’t rolled over yet, so the prevailing trend is still bullish.
My alert is set at 475. A monthly candle close above the line would confirm the next move towards 615. The bearish scenario would be confirmed with a monthly candle close below 325. The ensuing target would be 177.
See you soon for “Netflix the movie: Part2” !