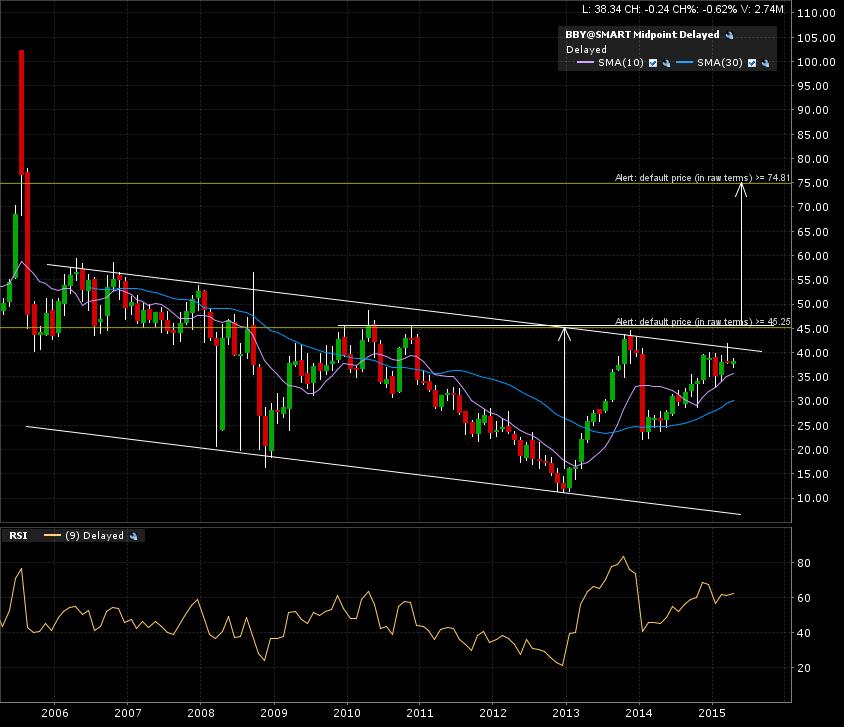
Is it time to buy Best Buy Co. Inc. (BBY:NYSE)? Well, maybe soon enough. A BIG +7 year descending channel/base in progress.
Here is the 10 year monthly candle chart. I have the breakout line at 45. I rather wait for a horizontal line break before confirming a breakout. I believe this adds value to the setup and increases the probability of reaching my possible target.
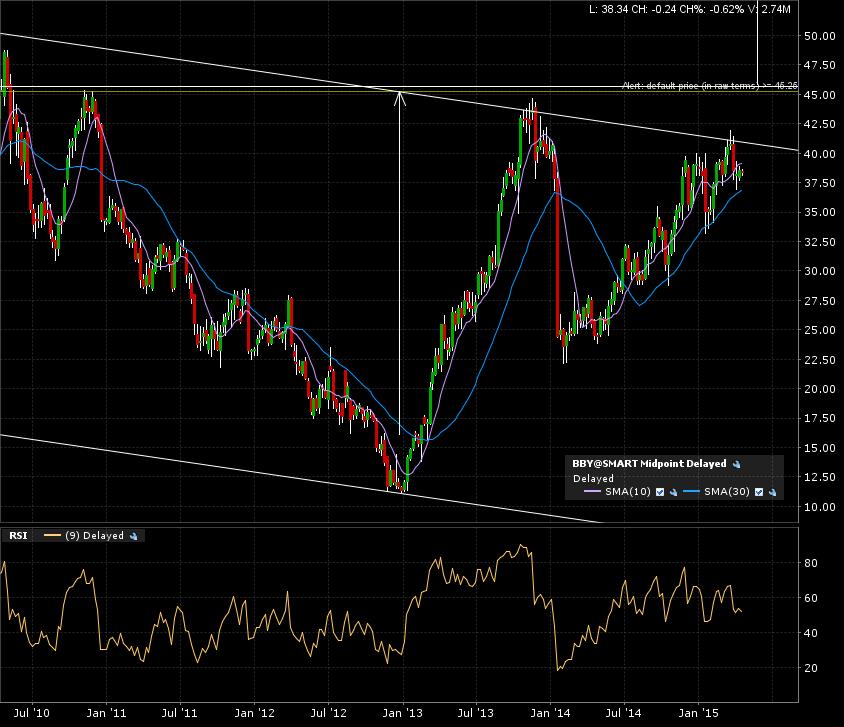
The 5 year weekly candle chart shows the descending channel’s upper boundary being tested.
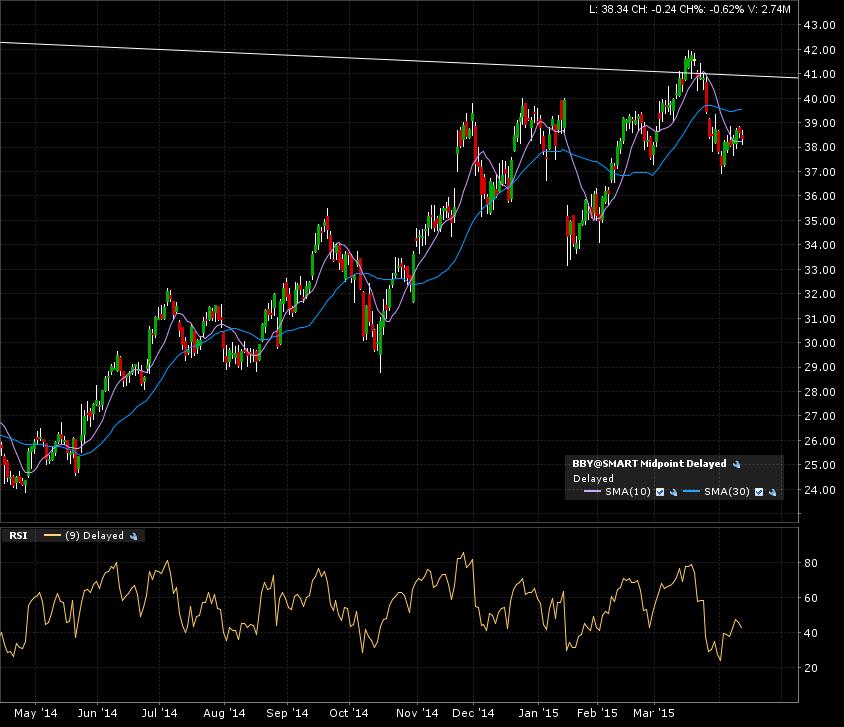
Zoom in on the 1 year daily candle chart shows the price action trending nicely towards the descending trend line.
I have my alert set at 45 and will wait for a monthly candle close before confirming this breakout. Ensuing target would be a measured move to 75.
So, the time to enter is not now, but an opportunity is very close by!