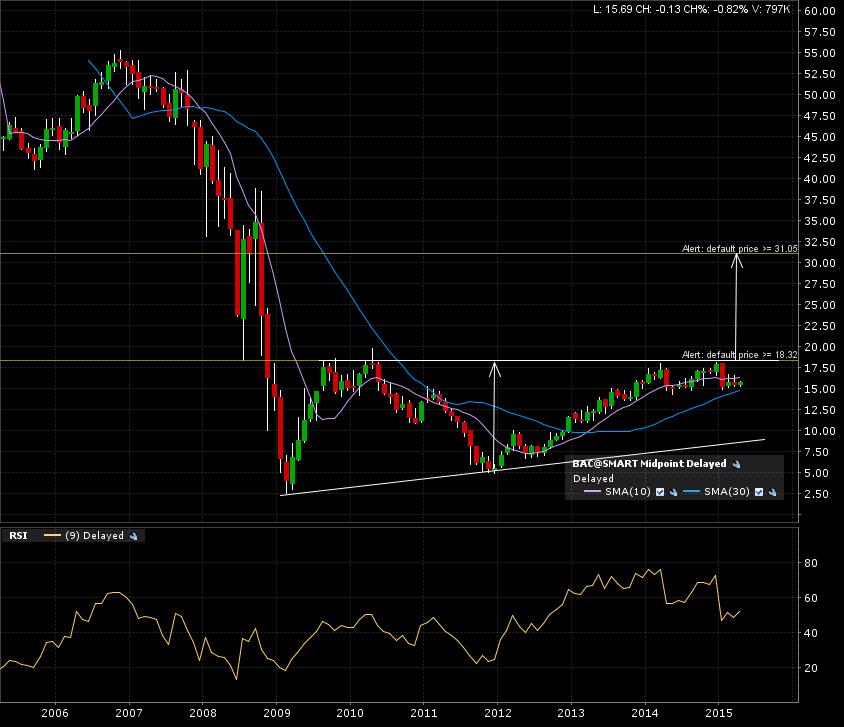
Bank of America Corp. (BAC:NYSE) has hit it’s breakout line and might try another run soon enough. Check out the 10 year monthly candle chart. That is one BIG +6 years ascending triangle in progress (a usually classical chart bullish continuation pattern).
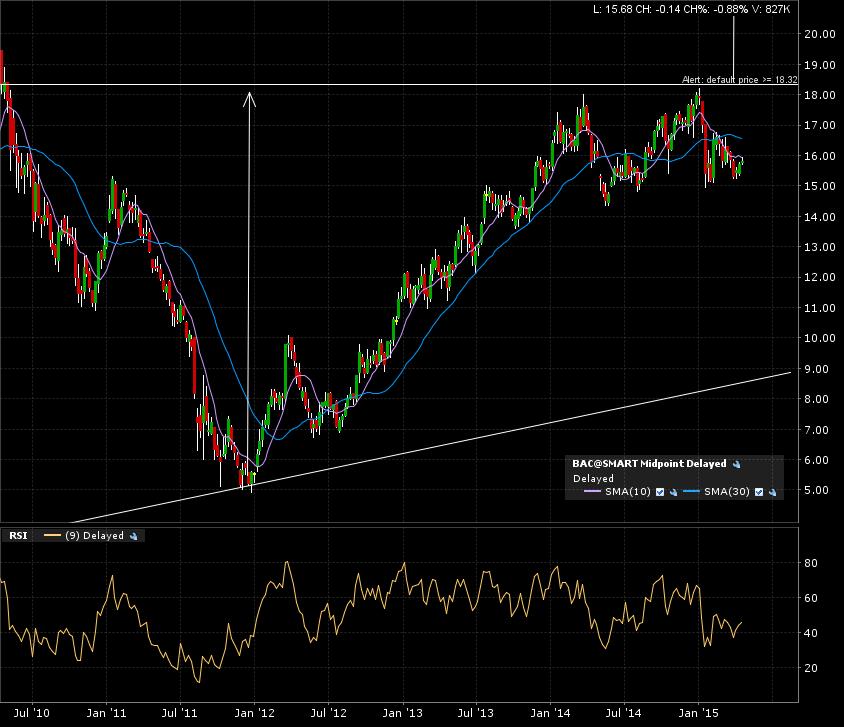
The 5 year weekly candle chart shows the two most recent test of the breakout line (resistance) at 18.50.
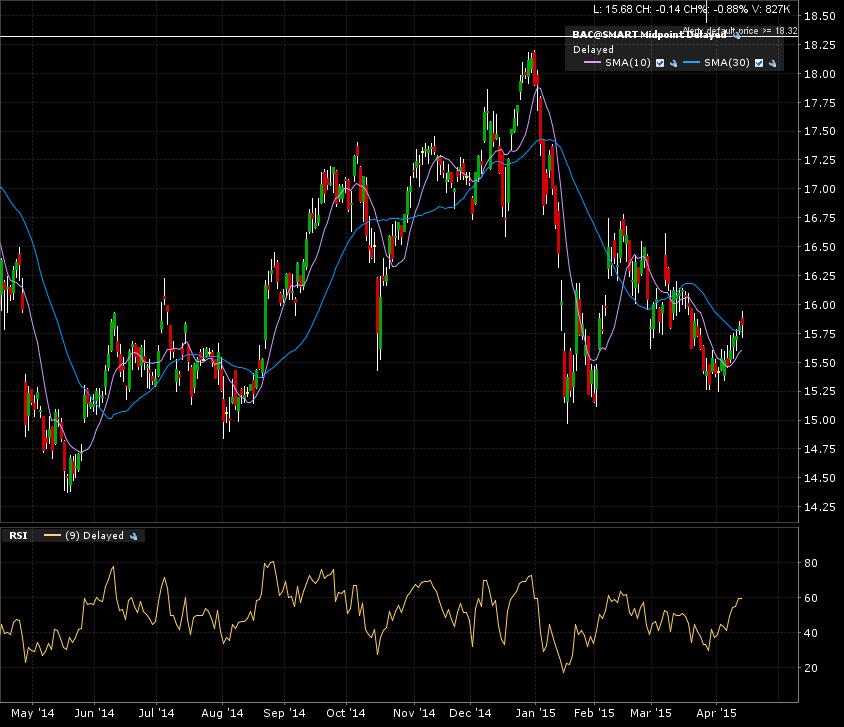
Here is the zoom in on the 1 year daily candle chart. Pretty much in no man’s land. Thank goodness for the larger time frames giving me a bird’s eye view of the prevailing trend. Check out my “top to bottom approach” here.
This is it, my alerts are set. I’ll come back to this once the 18.50 is broken. A monthly candle close above that level will give me a target of 31.
Now that would be a great comeback for the Bank of America Corp!