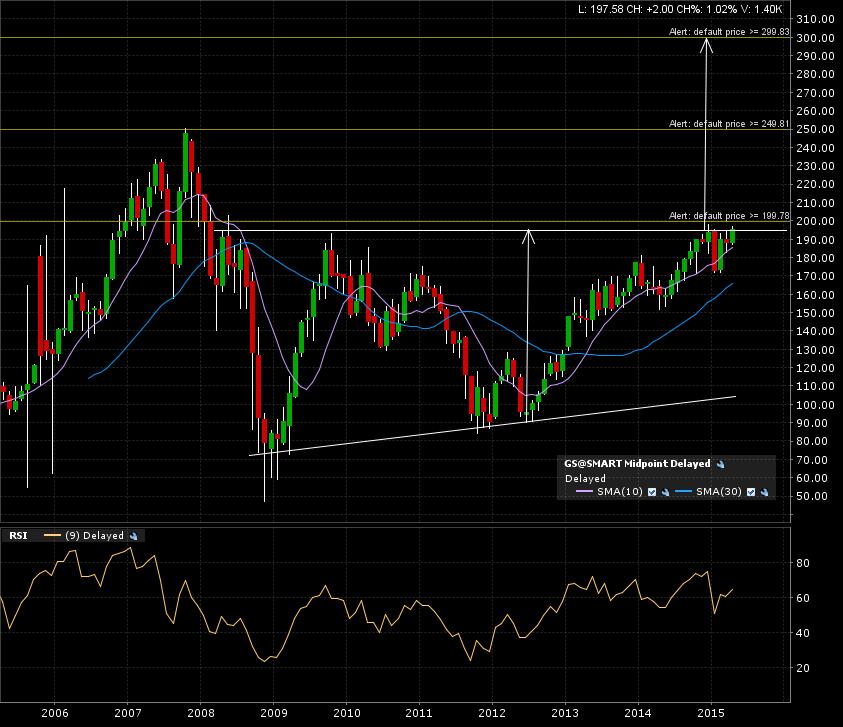
The Goldman Sachs Group (GS:NYSE) is on the brink of a BIG bullish move. Check out the 10 year monthly candle chart. A +6 year ascending triangle classical chart pattern in progress. Some shorter term consolidation pattern on the breakout line of 200. I believe these smaller chart pattern sharing a breakout line with a bigger time frame’s breakout line adds value to the setup.
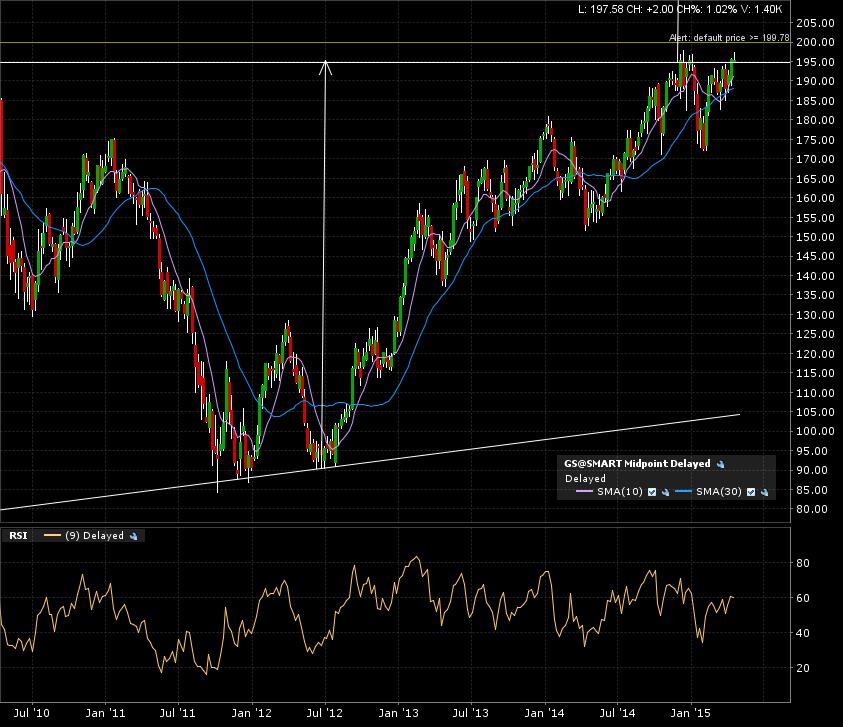
Here is the 5 year weekly candle chart. A small 9 month consolidation pattern on the breakout line (resistance).
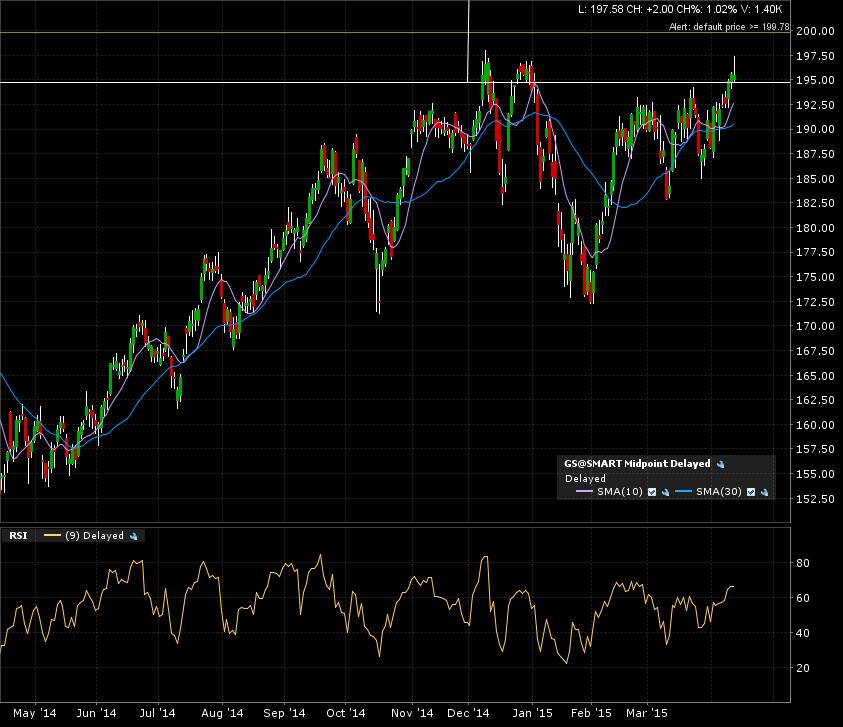
Zoom in on the daily candle 1 year chart. The price action is working its way to my alert set at 200.
My alert is set. A monthly candle close above 200 will give me an implied measured move added to that breakout line of 300. The caveat is the possible WALL (resistance) on the way to target. A have an alert set at 250. I would analyse the situation once triggered and possibly envision an early exit at that point.