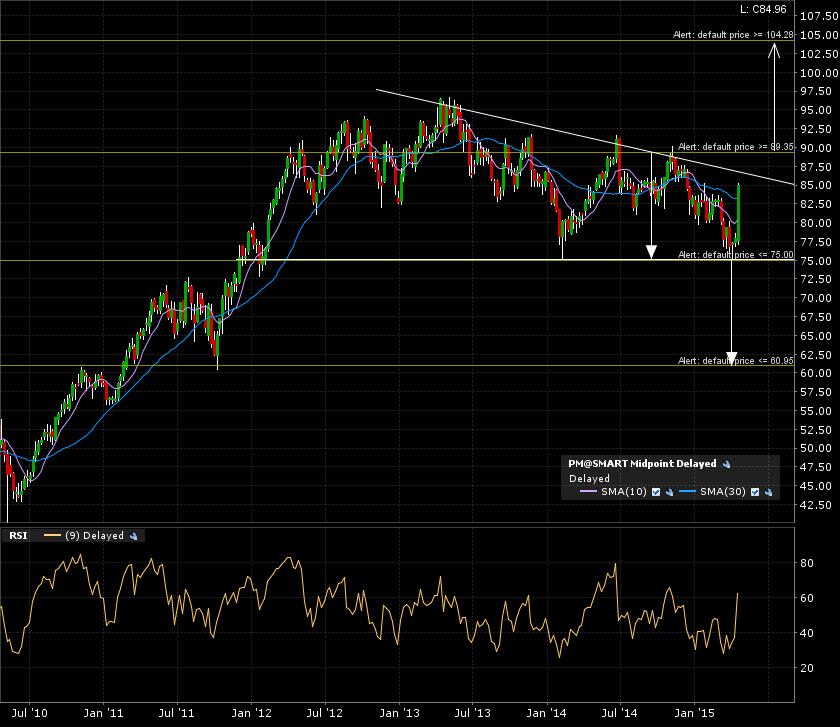
Philip Morris International, Inc. (PM:NYSE) has been consolidating for the past +3 years. There are presently 2 possible scenarios, one bullish and the other bearish! Check out the monthly candle chart. I have arrows for the next possible moves depending on which breakout line is breached.

Here is the 5 year weekly candle chart. The breakdown line (support) is set at 75. The breakout line (resistance) is set at 90.
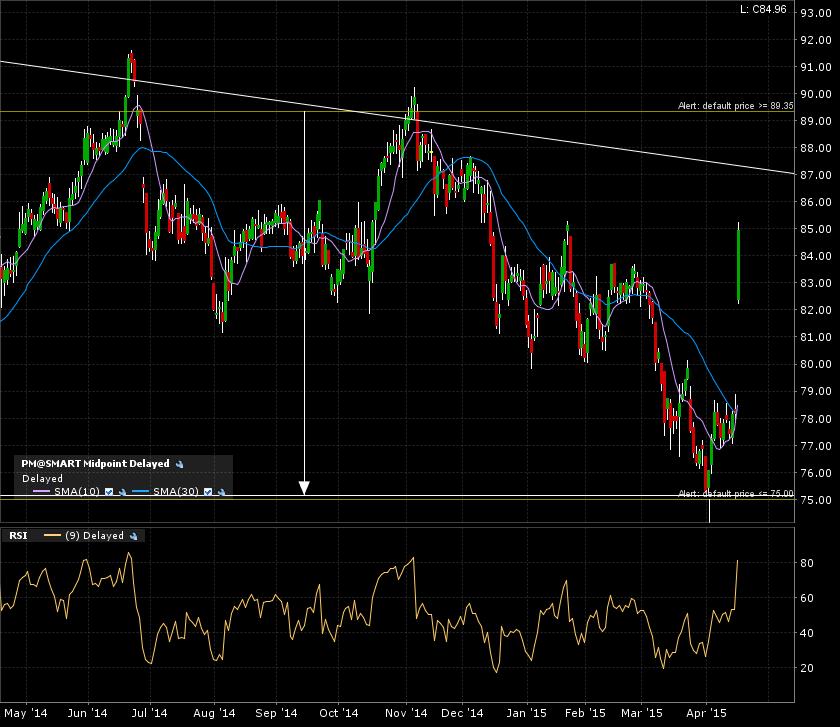
Zoom in on the 1 year daily candle chart. Price action in no man’s land. Will need some time before the next break line test.
My alerts are set. Again, a monthly candle close is required to confirm the next target. 60 for the bearish case, 105 for the bullish case.
Note, although the price action is approaching the upper resistance line for the bullish scenario, the moving averages on the monthly chart are rolling over, indicating the possible start of a bearish trend.
I sure don’t know the future, but that doesn’t mean I can’t be prepared for both eventualities!