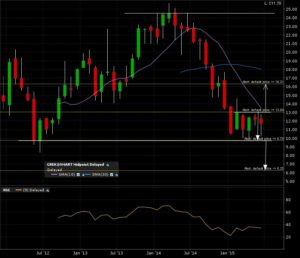
The Global X FTSE Greece 20 ETF is consolidating around important support around the 10 level. I see 2 scenarios possible. Either the bullish reversal after resolving this pattern OR a bearish continuation. Check out the monthly candle chart along with the arrows indicating the implied measured moves added to their breakout line. A monthly candle close above 13 will give me a target of 16.5, also coinciding with a “WALL”. A monthly candle close below 9.5 will give me a target of 6.
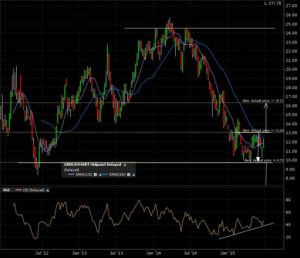
Here is the weekly candle chart. The case for a bullish reversal is the bullish divergence with the RSI.
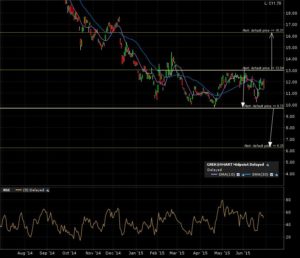
Zooming in on the 1 year daily candle chart. The price action is right now in no man’s land.
This might need a little more time to marinate. That is why patience is a key factor to not rush into moves. I set my alerts at the breakout lines for either the bullish OR bearish case. I’ll come back to this when triggered.


