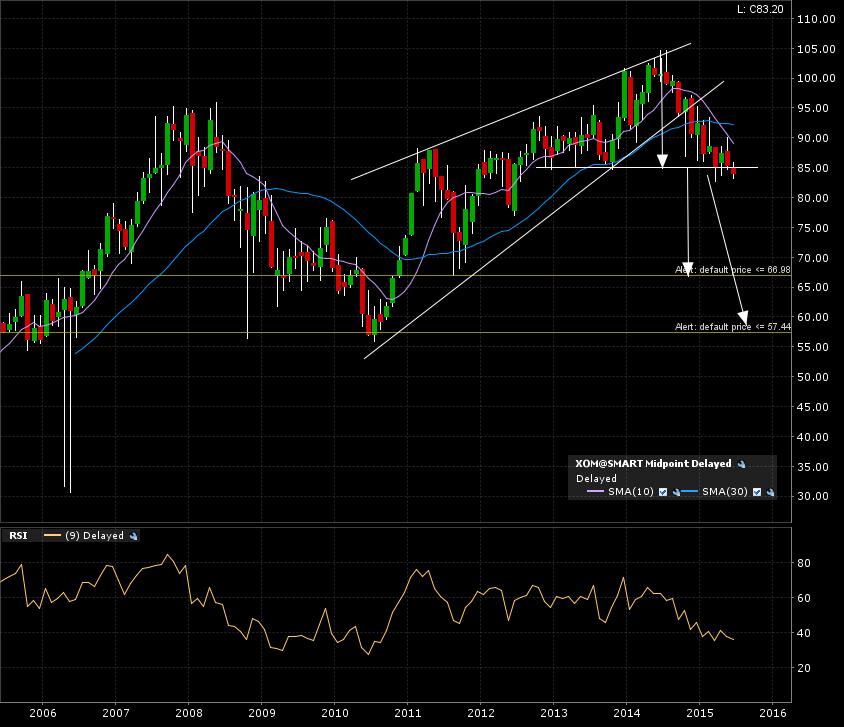
On April 8th, I wrote this interessting post for Exxon (XOM:NYSE) to demonstrate the concept of “chart morphing”. Check it out here! Some time has passed and the “morphed” chart is now close to resolving. Let’s check out the 10 year monthly candle chart. There are now 2 top formations sharing the same breakdown line. I believe this gives added value to the eventual breakdown, increasing the probabilites of reaching the possible target. A+ materiel.
The first target is 67. This also coincides with a “WALL”. Check this previous post which explains this concept. The more further target is the move implied by the “rising wedge” classical chart formation, hence the start of the formation at 57.50
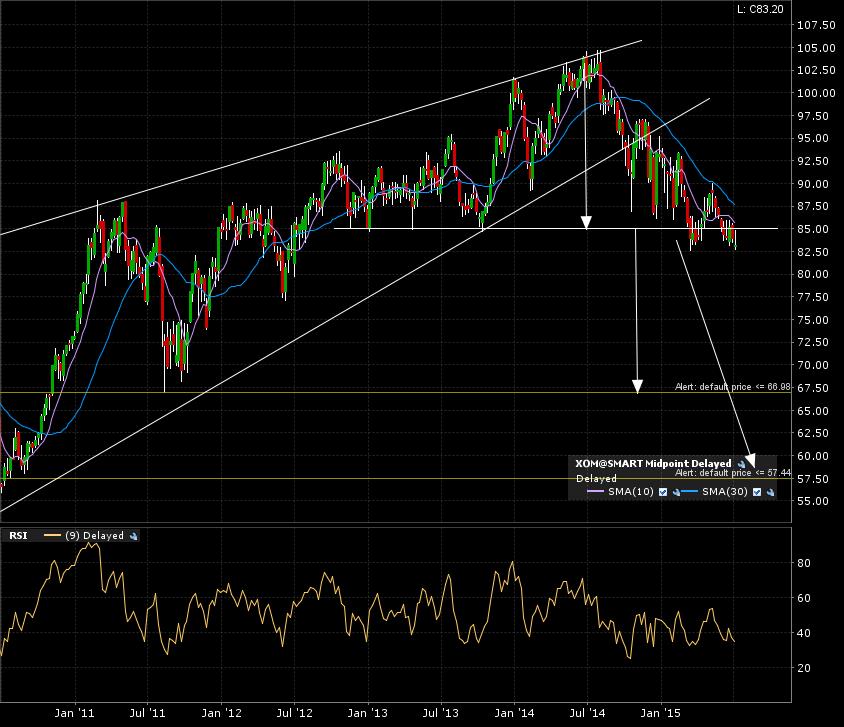
Here is the 5 year weekly candle chart. Some noise below the breakdown line of 85. Check this post on the concept of “noise”.
Zoom in on the 1 year daily candle chart. Some more noise.
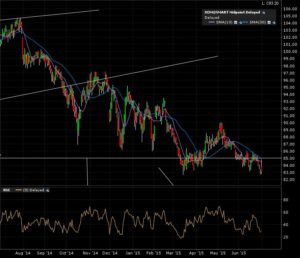
This is delicate. Bearish breakdown signs are there, but I’d rather wait for this month’s close before calling this a drowner! Always make room for patience.