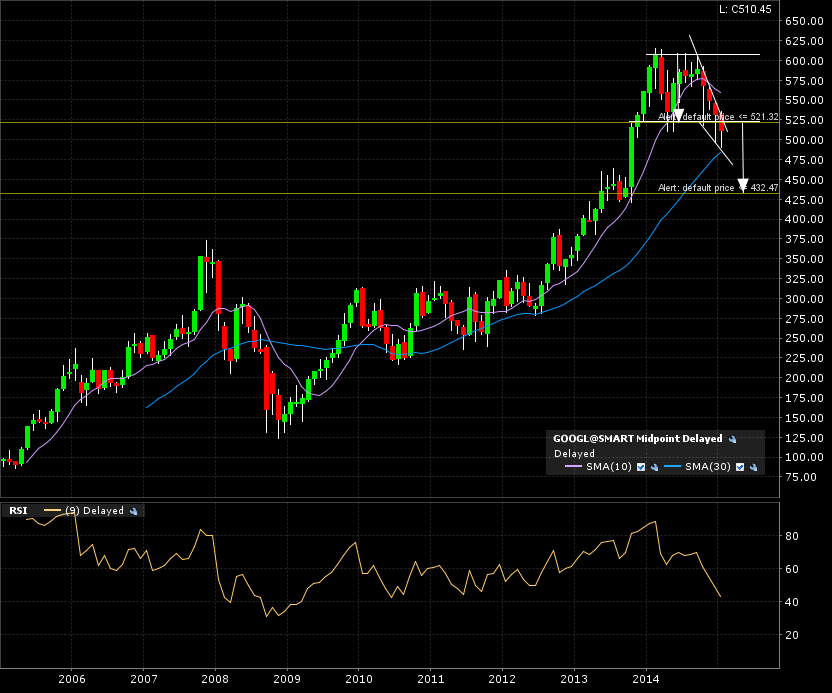
A 1 year top formation breakdown happening with Google. We can see on the following monthly candle 10 year chart the horizontal support giving way at the 521 mark. The top formation has morphed into the classical chart pattern “falling wedge”.
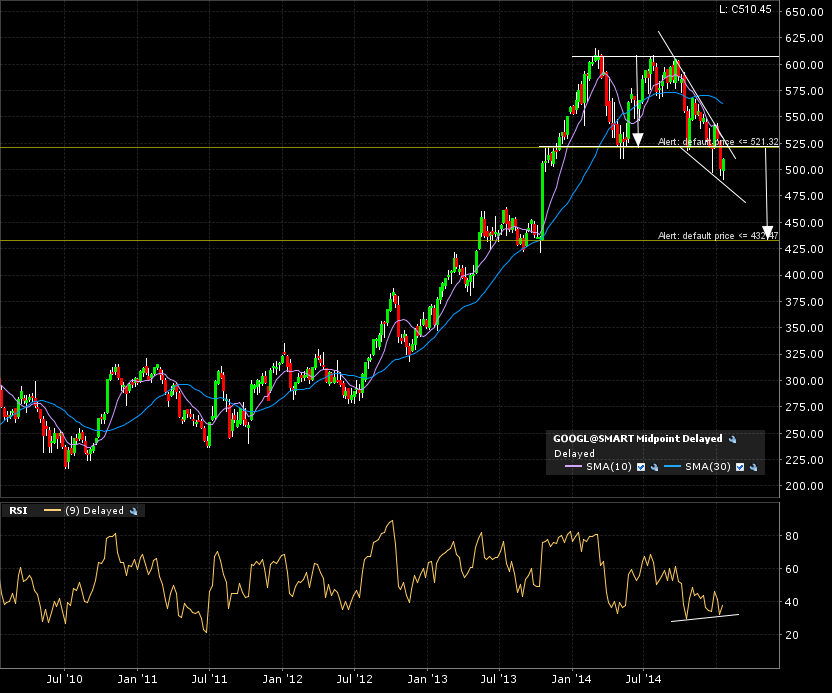
On the 5 year weekly candle chart, we can see some bullish divergence with the RSI.
Same thing on the daily candle 1 year zoom.
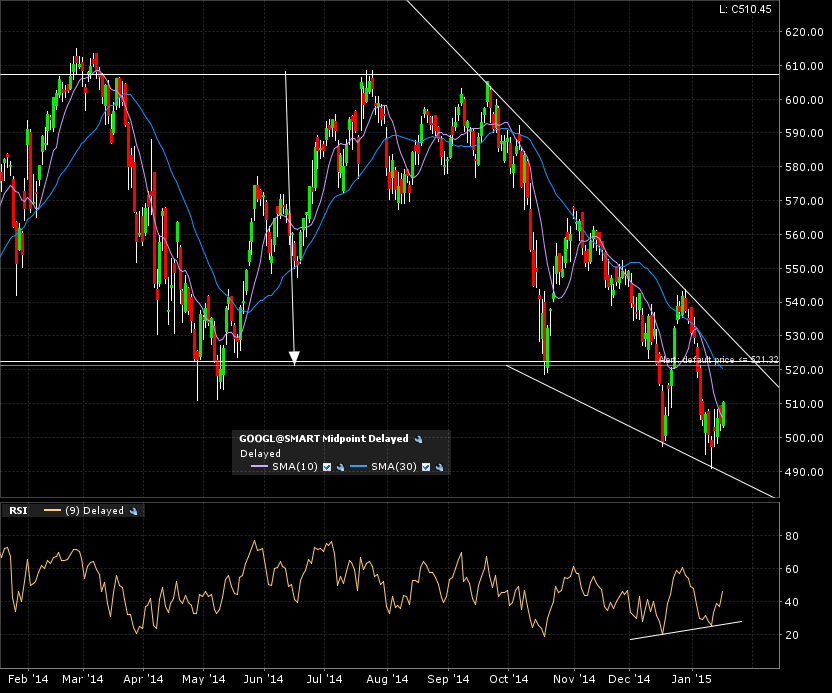
Will the falling wedge extend all the way to the target of 432 (also previous support area)? Or retrace and break back above to previous highs at 600? Falling wedge are regarded as bullish reversal patterns. Check out this chart school link .
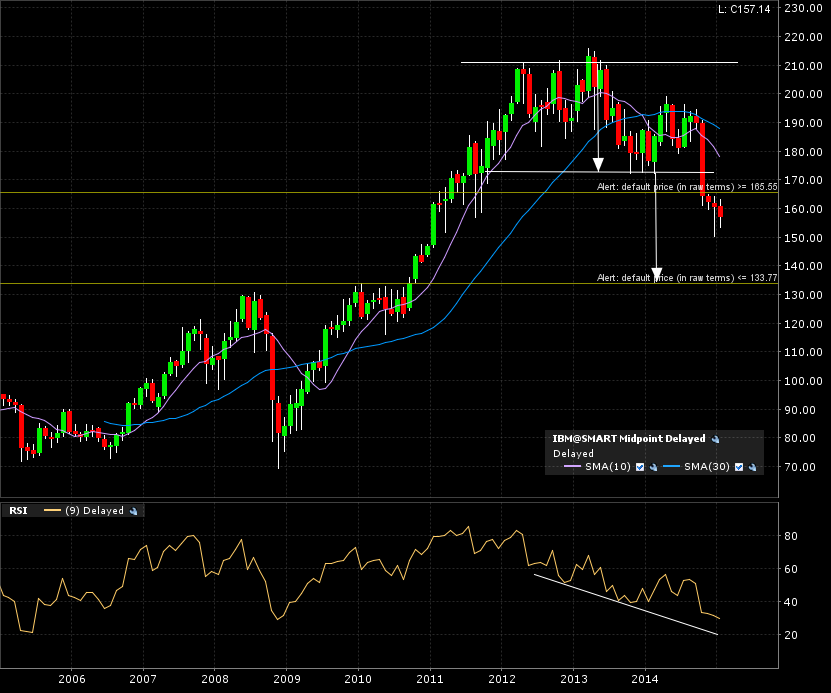
If IBM is a precursor to tech stocks, it may well break down to the implied measured target.
Here is the monthly candle 10 year chart for IBM:
I’m going to wait and see if the retrace will fail on the previous support and now resistance at 521.
But it isn’t looking good as the moving averages have started to flatten out and roll over…