After having a look at Google and IBM, I decided to see if other “techie” type stocks are giving signs of rolling over.
Enter Ebay. After a target attained from an initial breakout in late 2010, Ebay has been nicely consolidating in a rectangle formation for the past 2 years on the monthly candle 10 year chart:
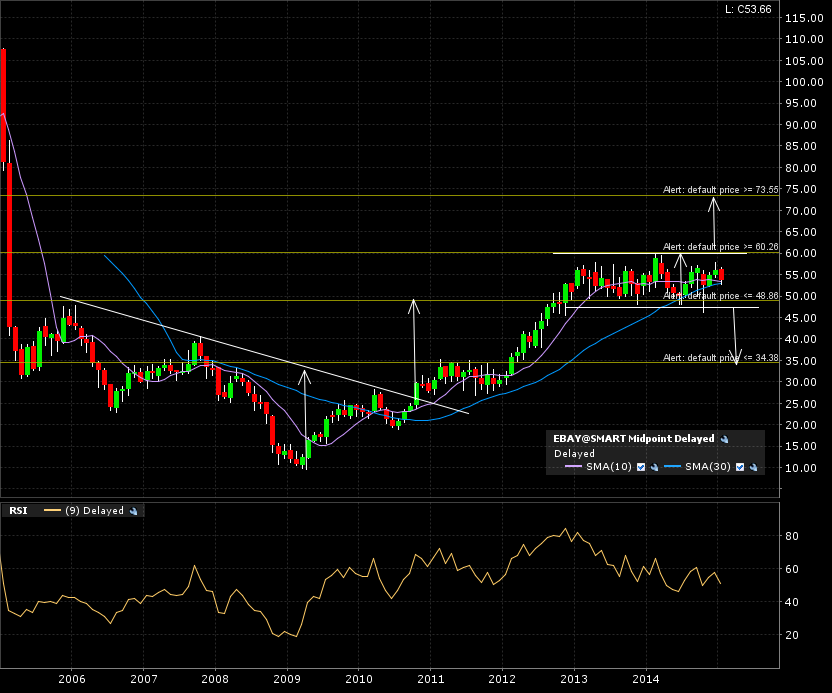
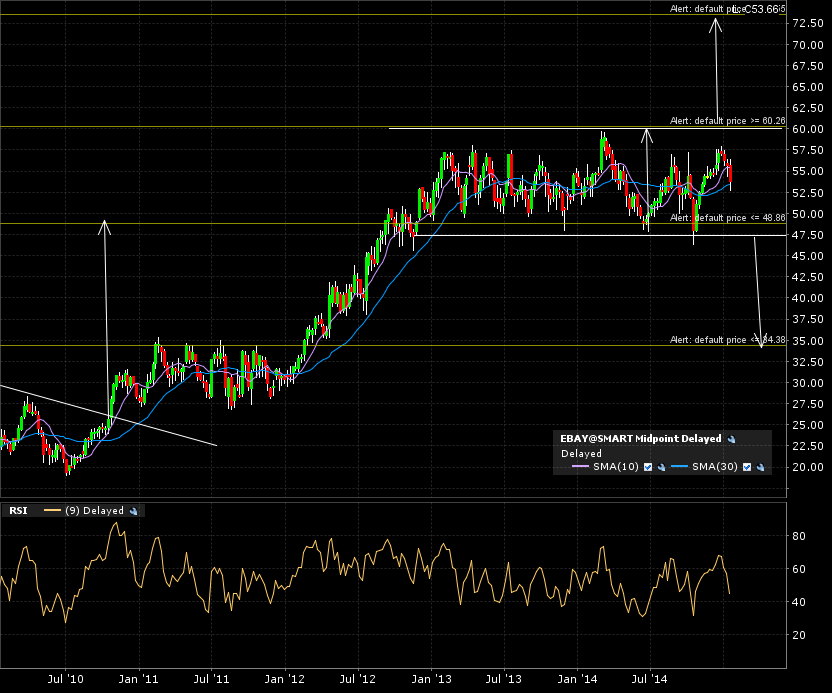
I have alerts at 60.26 and 48.86. Once triggered, I’ll wait and see if a monthly close below those levels give me the proper ri:re I’m looking for in A+ setups. Here is a zoom in with weekly candles on a 5 year chart.
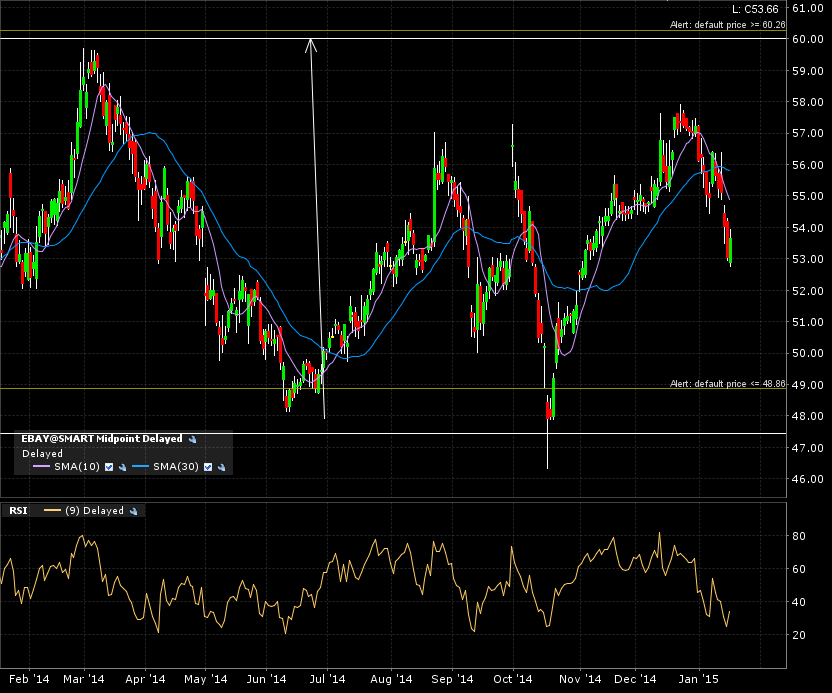
The daily action is pretty much in no-man’s land.
Enter Facebook. No 10 year chart for this young buck! A look at the 5 year weekly candle chart show a strong push out of an ascending triangle in August 2013. Now has been consolidating for the past 6 months.
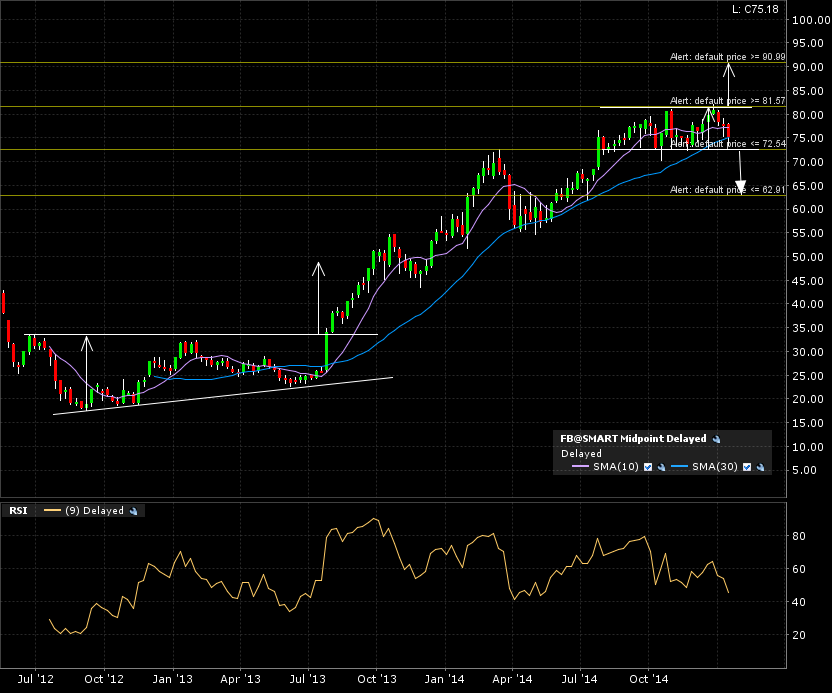
The daily candle 1 year chart shows us a recent test of the lower rectangle boundary.

The measured move targets are indicated by the arrows, either up or down. Right now I would prefer a breakout (or breakdown) on Ebay, as the consolidation pattern has been ongoing for much longer.
Again, the longer the base… the higher in space!