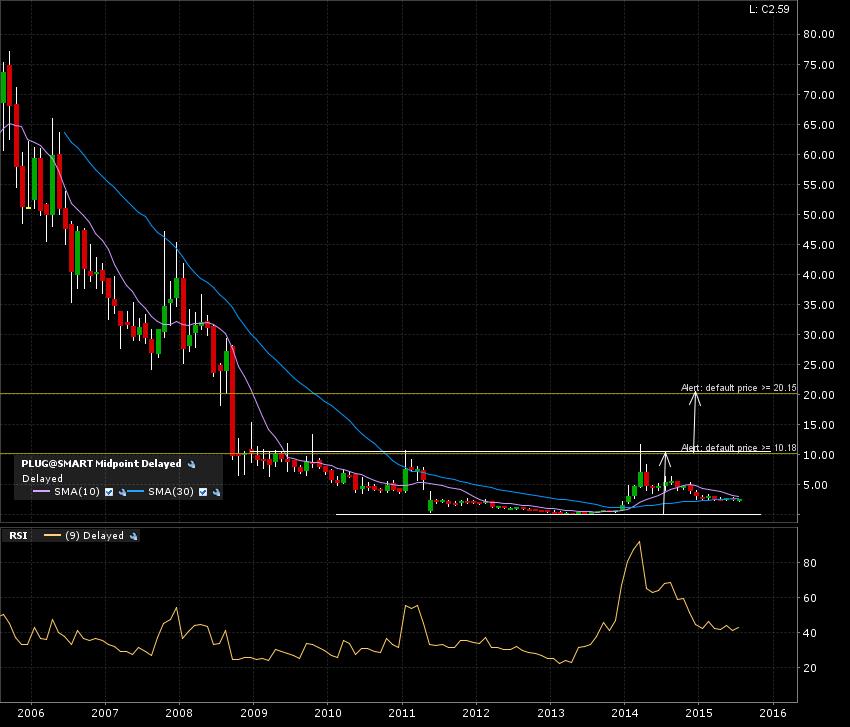
Plug Power Inc. (PLUG:NASDAQ) is far off it’s +80 price action some +10 years ago. Right now in the lower end of a HUGE +7 year base. Check out the 10 year monthly candle chart. I have the breakout line of the HUGE base at 10, giving an eventual target at 20. The bigger the base, the higher in space!
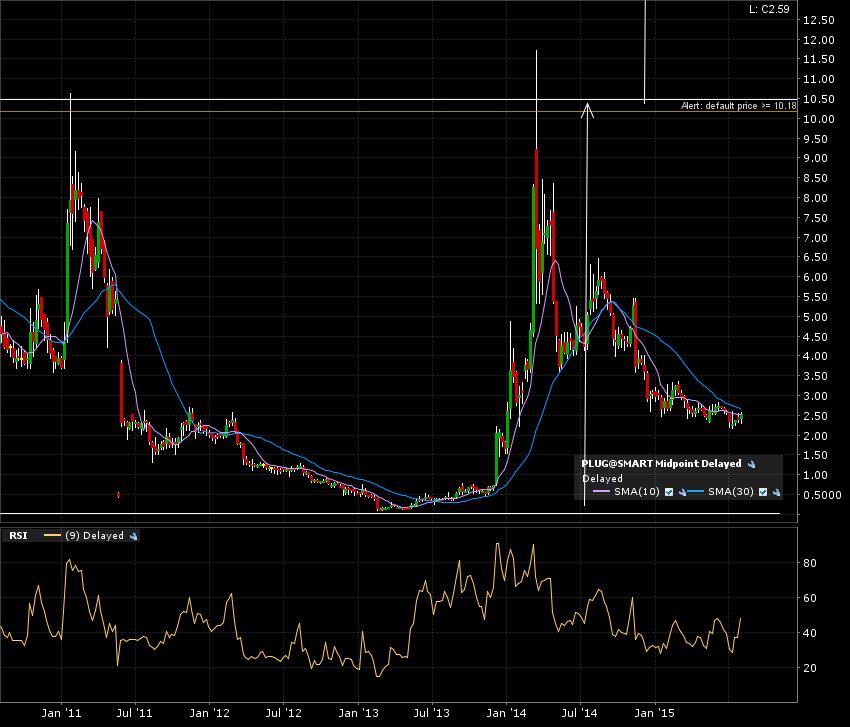
Here is the 5 year weekly candle chart. Twice in that period has the price action tested the breakout line. Some “noise” above the 10 level, but no monthly candle confirmation. Check this post on my concept of “noise reduction”.
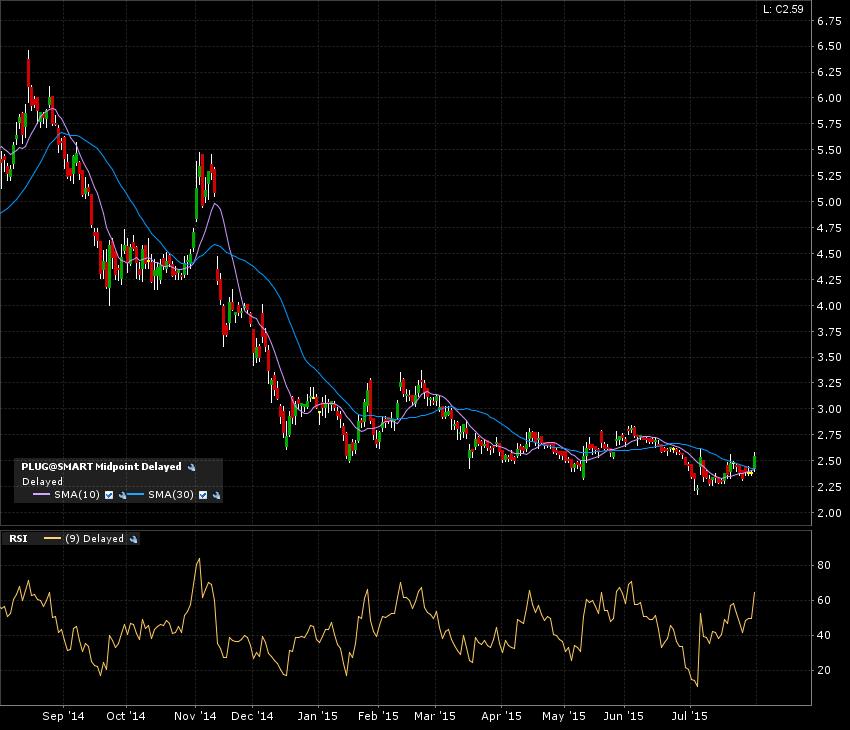
And a final zoom in on the daily 1 year candle chart. Couldn’t tell from this shorter time frame the “bigger picture” drawing out. You can take a look at this post on how larger time frames help see the important prevailing trend.
I set my alert at 10. Will come back to this when triggered. Patience required!