This is for a user request for an update analysis on Apple (AAPL:NASDAQ). Back in early February, I wrote a post on Apple. Check it out here. The target of 135 was missed by inches! Time has passed and the chart has morphed, giving a different perspective.
I regularly redraw my lines when looking at the same instrument. This might take me a little more time, but will average out “biased” or “skewed” views I might have when those lines are drawn. Classical charting is NOT a science, more of an ART. Human’s buy and sell, thus the charts underlining those actions will represent some of this human behavior, greed AND fear.
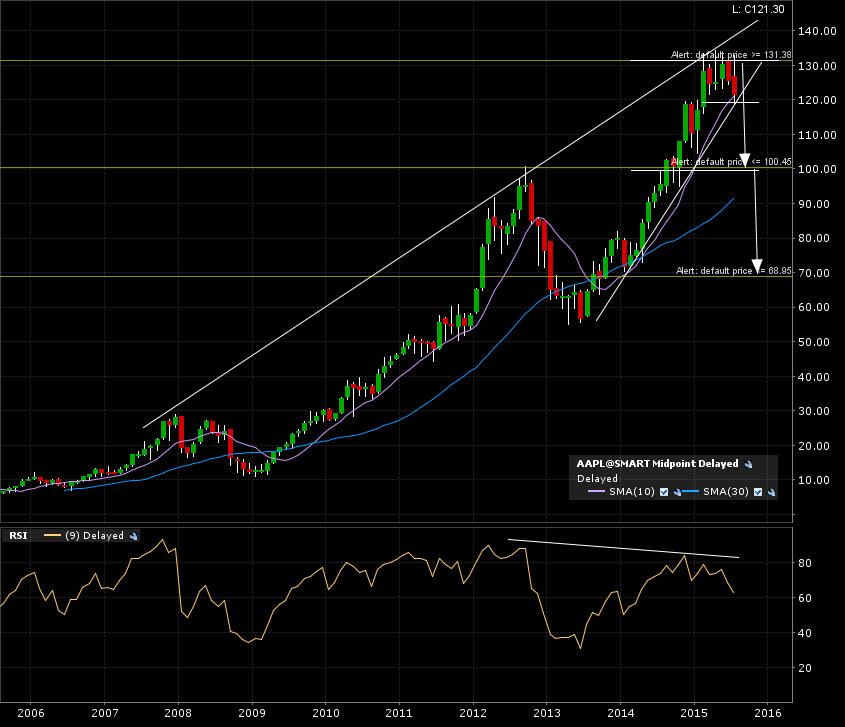
All right, back to the analysis. Check out the monthly candle chart. Resistance hit close to 135, and a small consolidation pattern is in the works. Might be a “rising wedge” reversal classical chart formation in play. Bearish divergence wth th RSI also support this possibility.
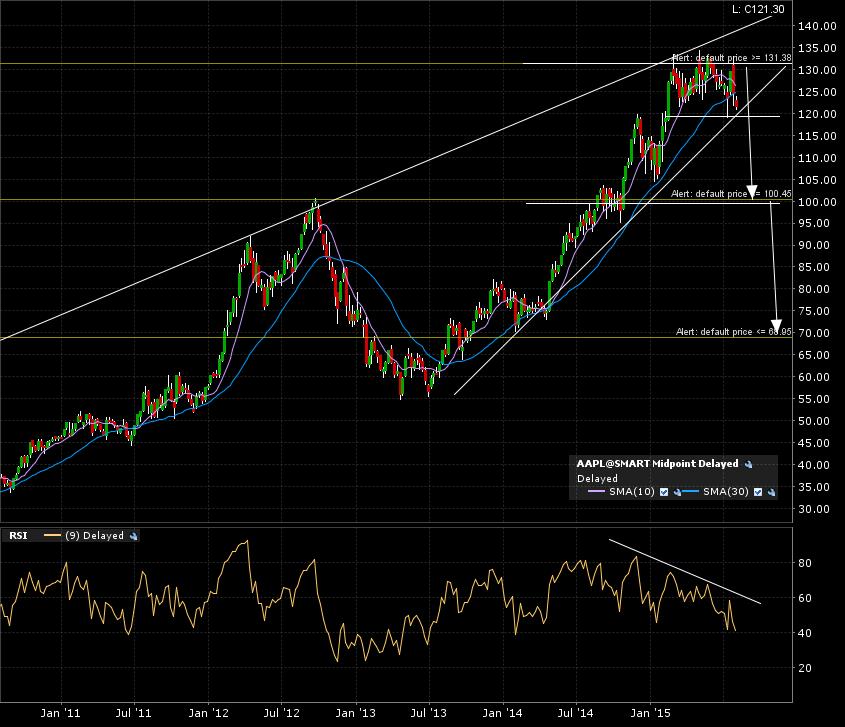
Here is the 5 year weekly candle chart.
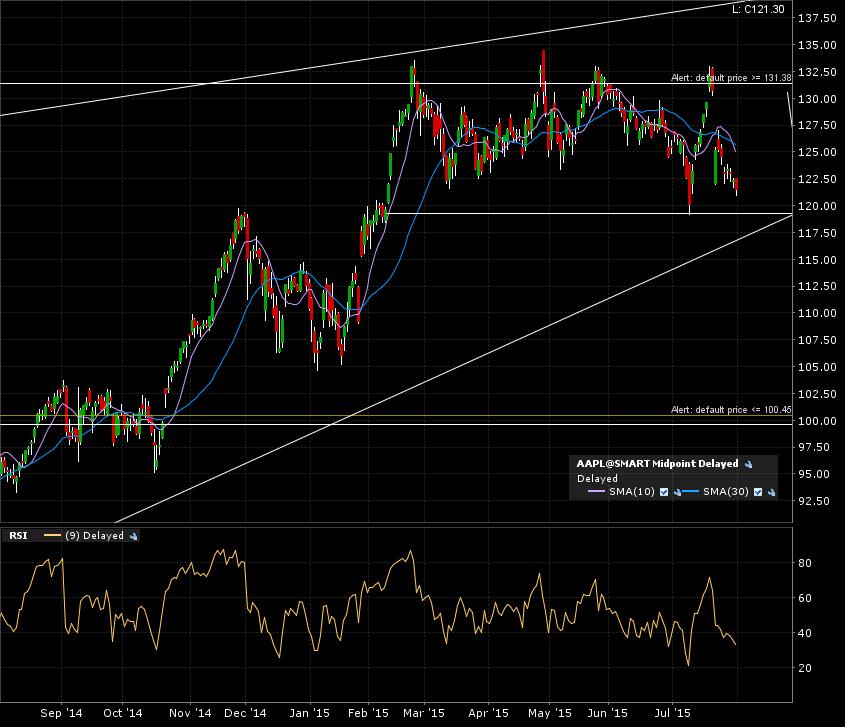
A final zoom in on the 1 year daily candle chart demonstrates the pass 6 month consolidation.
I have my alerts set. First target is 100 after a confirmed break under 118. The second more further target is 70, after a monthly candle close below 100 for confirmation. A break above 132 will invalidate these bearish scenarios.
Easy picking up my Apple when on the ground!