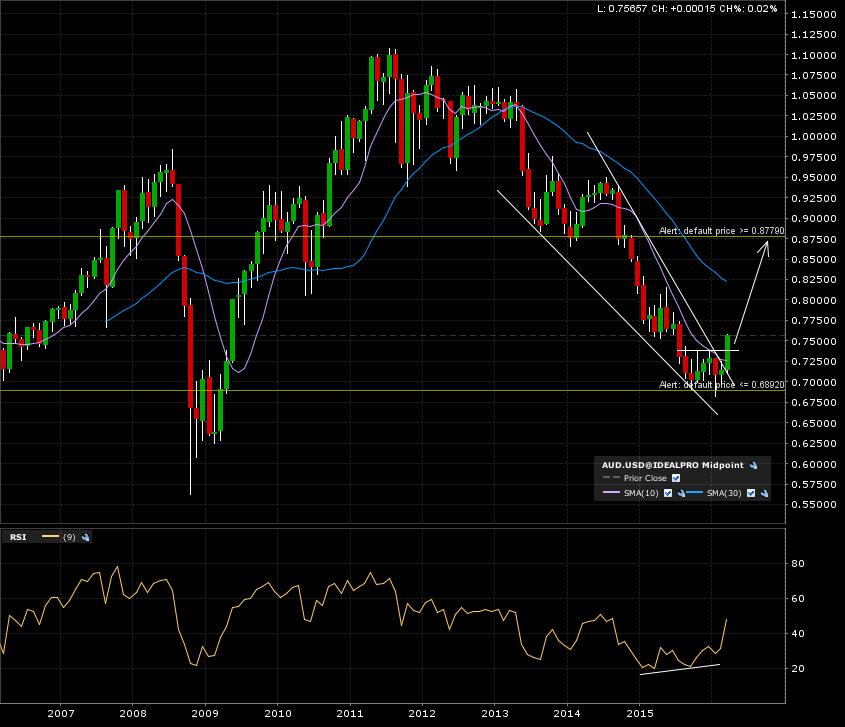
The AUDUSD forex pair could be breaking out of the classical reversal chart formation “falling wedge“. Check out the 10 year monthly candle chart. Target is adjusted to the closest “wall” at 87.50.
The 5 year weekly candle chart is more of the same. Better view on the breaking out from the possible bottom.
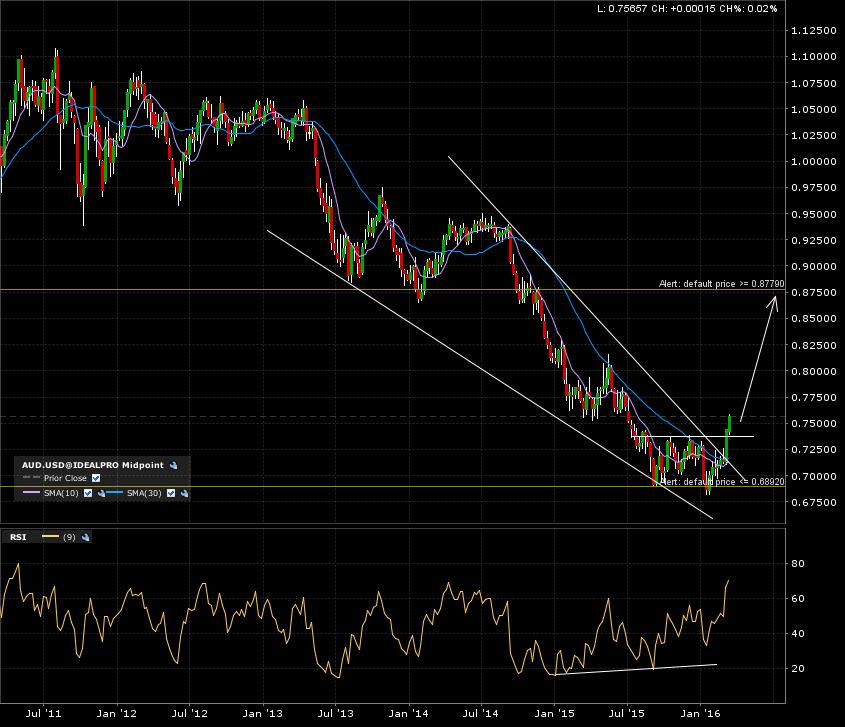
Notice some “bullish divergence” on these charts. This adds value and probabity to the possible pending reversal move.
Here is the zoom in on the 1 year daily candle chart.
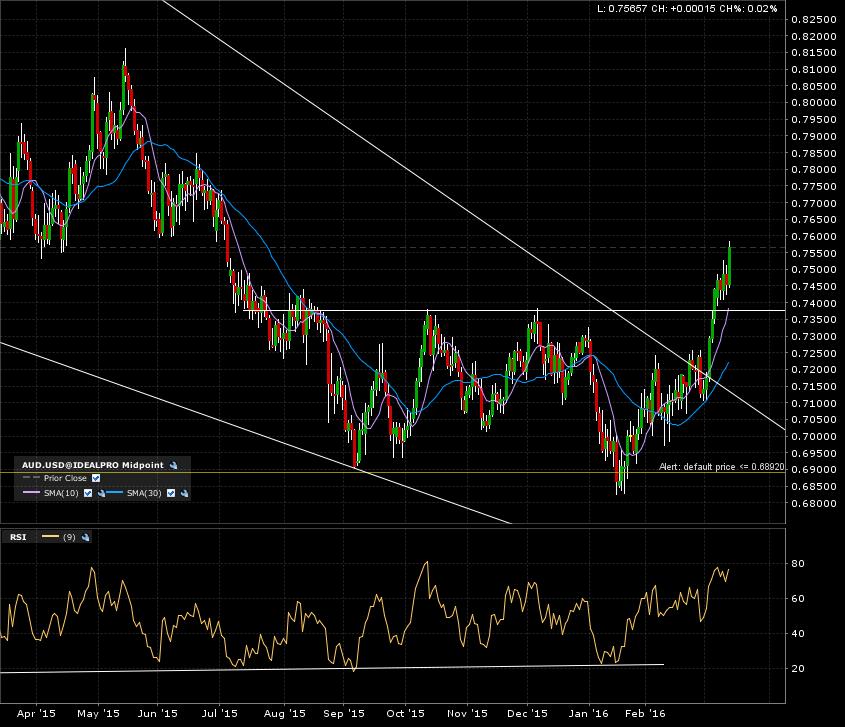
Breakout confirmed on the weekly and daily candle charts. Need to wait for monthly canle close for confirmation! Hold on… just a little more “patience” required.