For those not aware on my trading framework, I invite you to go through the links in my “How To” section.
All right, back to business!
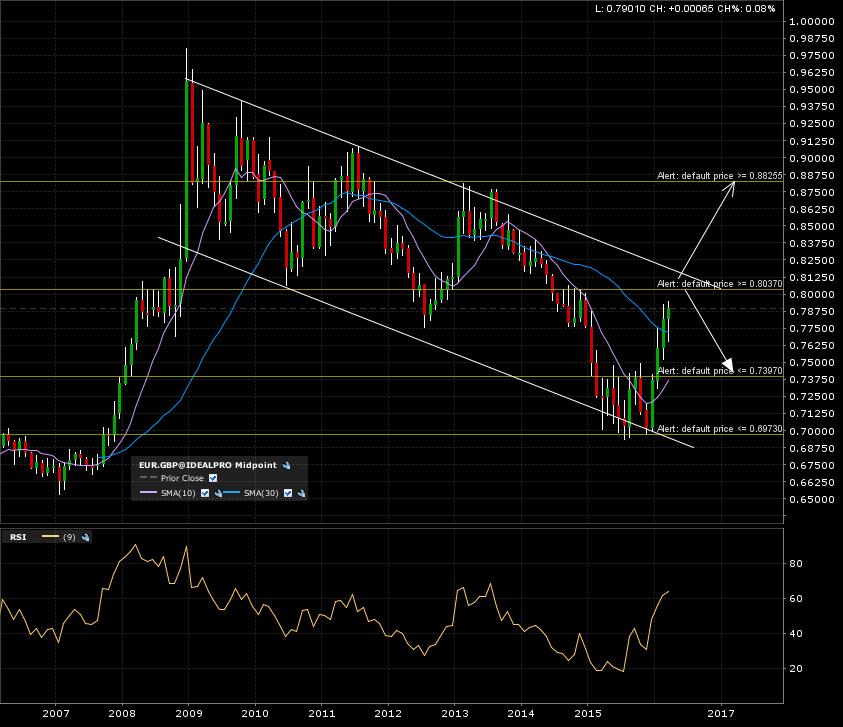
The eurgbp forex pair has retraced back to previous breakdown levels and is going to test it. This also coincides with the upper boundary of the descending channel. Here is the 10 year monthly candle chart with arrows indicating the next possible moves.
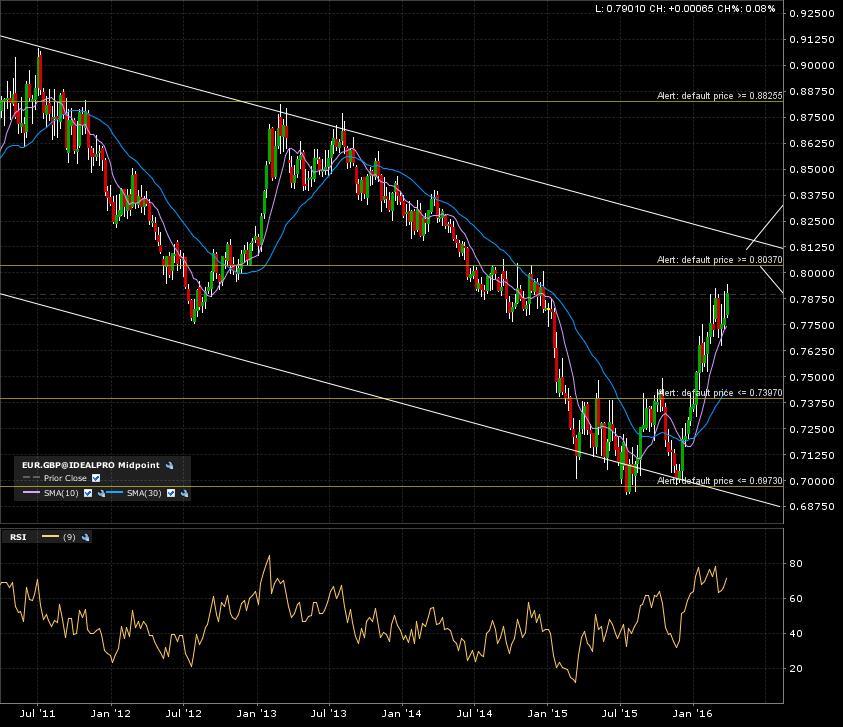
The 5 year weekly candle chart shows the price action approaching the 80 level and eventual test.
A final zoom in on the 1 year daily candle chart show the recent bullish action.
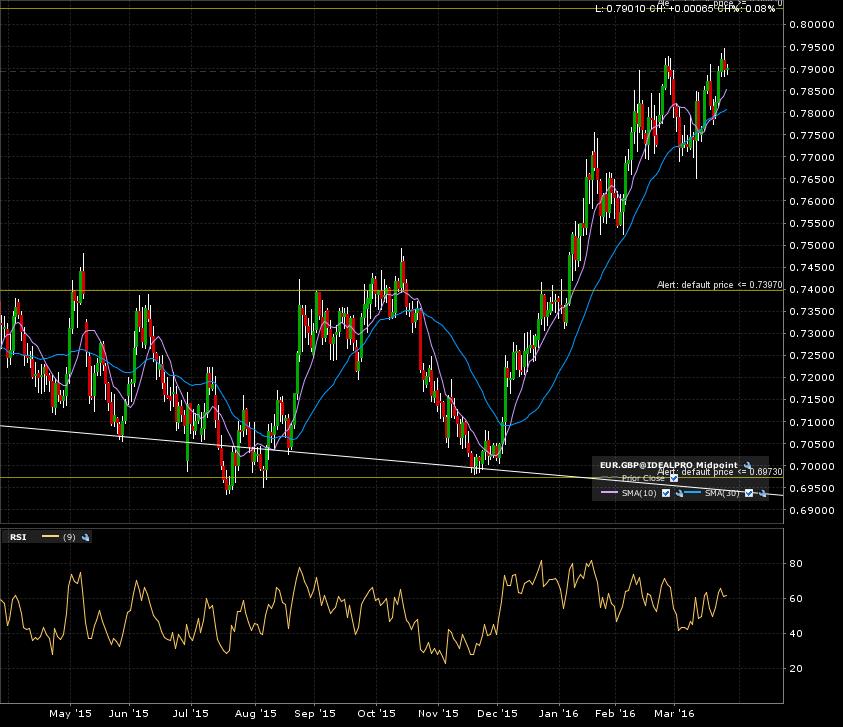
So it’s a little early for this one. I set my alerts and will see if this bounces back down off the 80 mark all the way to 74 OR a break out to the 88 level. Patience required.