Here is an ongoing example with eurhuf to demonstrate how a monthly candle chart would of saved me some whipsaws and an unnecessary loss on my ledger.
I’m going to use a “bottom to top” approach to better illustrate how this trap would of been avoided with a breakout confirmed only with a monthly candle close above the breakout line.
Look at this daily candle chart (1 year).
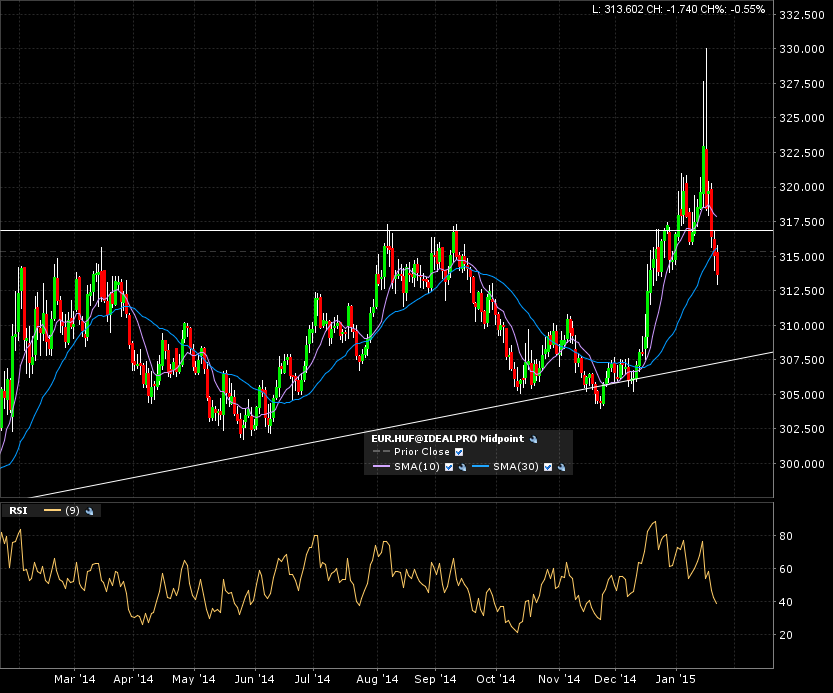
If I was only looking at daily candle charts for breakouts, I would of probably entered this trade. I would of felt uncomfortable as it would up retraced to test previous support before going my direction. My A+ setups usually don’t look back. They start off strong at breakout and trend nicely to target, without much pullbacks.
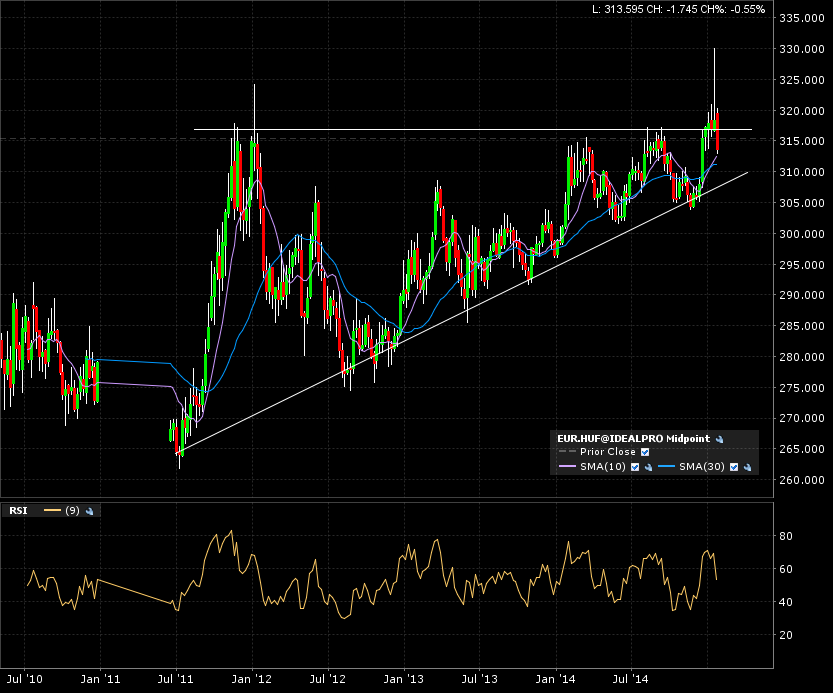
The weekly candle chart (5 years) shows us we might of been saved from entering the trade if we weren’t convinced of those weekly close above the breakout line. There is less noise than the daily candle chart, but still some.
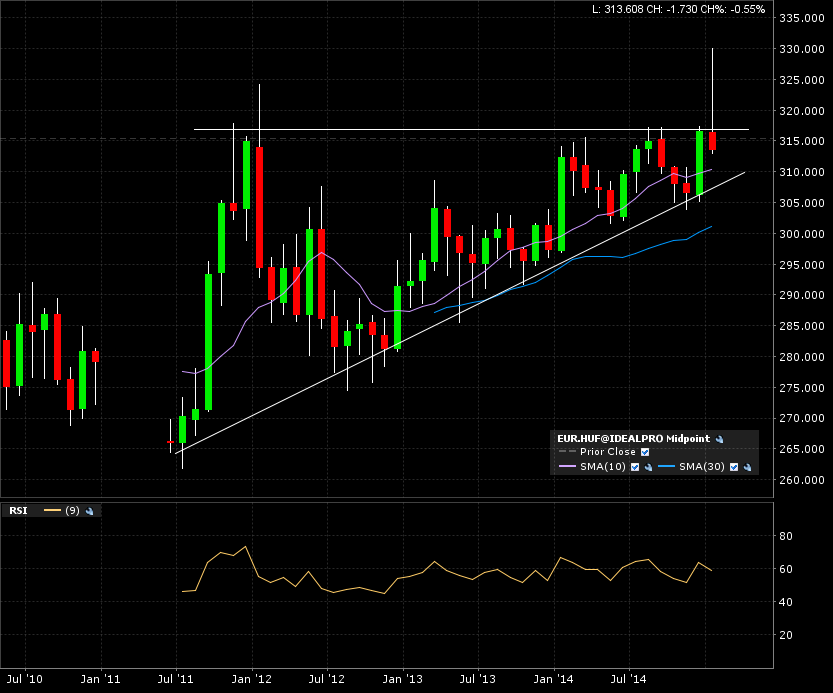
And here is the “noise reduced” monthly candle chart (9 years). The current candle is still ongoing, and who knows where it will close.
But it definitely isn’t telling you to enter the trade right now. If you wouldn’t of waited for the monthly close, you’d be in the red, and approaching your stop loss.
I know hind sight is 20/20, but keep in mind all 5 days of volatility, is encompassed in 1 weekly candle, and 4 weekly candles in 1 monthly candle.
That is a lot of noise reduction.