A bullish opportunity might be in the works for the us dollar against the Chinese Yuan.
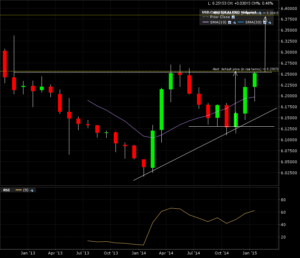
A nice 2 year base with a break line around the 6.2750 area. Check out the monthly candle chart (only 2 years of data).
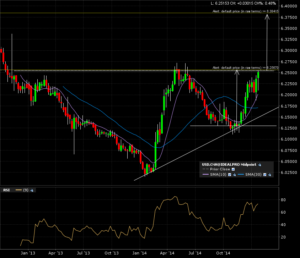
The weekly candle chart shows the approaching test of that important resistance.
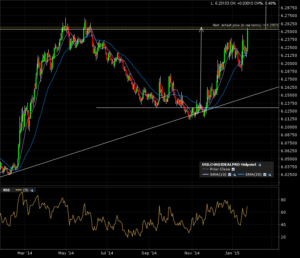
Here is the daily candle chart (1 year) for more fine detail.
The arrow would be the measured move after a convincing close above the breakout line. Just set the alert now and come back to this for revaluation when it sets off!


