When we look at daily and smaller time frames, we often don’t see the “bigger” picture. To demonstrate this, I’ll use the usd/cad currency pair.
I’ll also start from the “micro to macro” in order to zoom out the action.
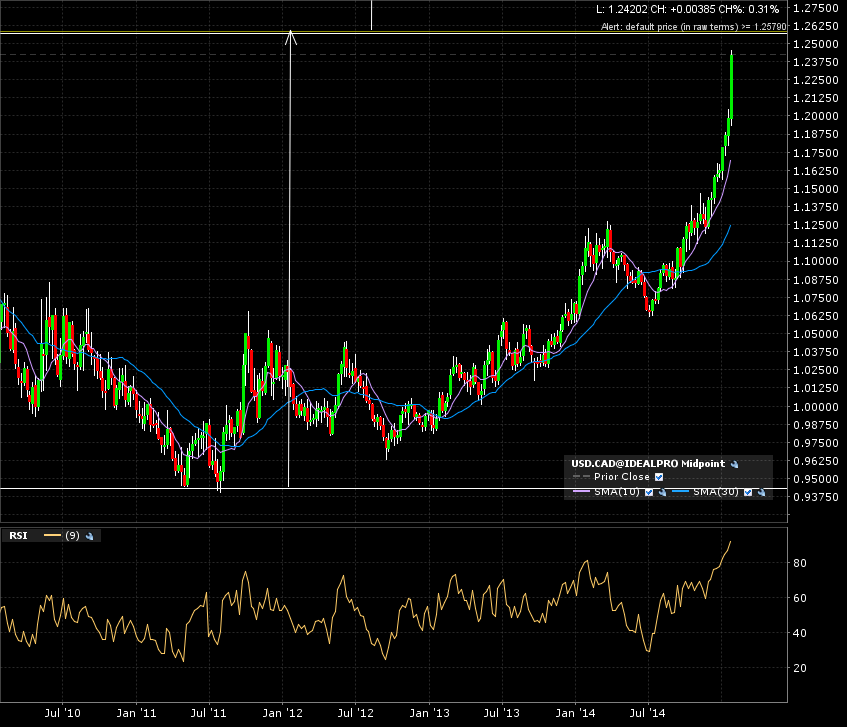
Here is the daily time frame on a yearly chart. If I only looked at this, I’d have no point of entry or vision of the next setup to enter. That price action just looks exponential. No classical chart pattern to give me a breakout line and target.

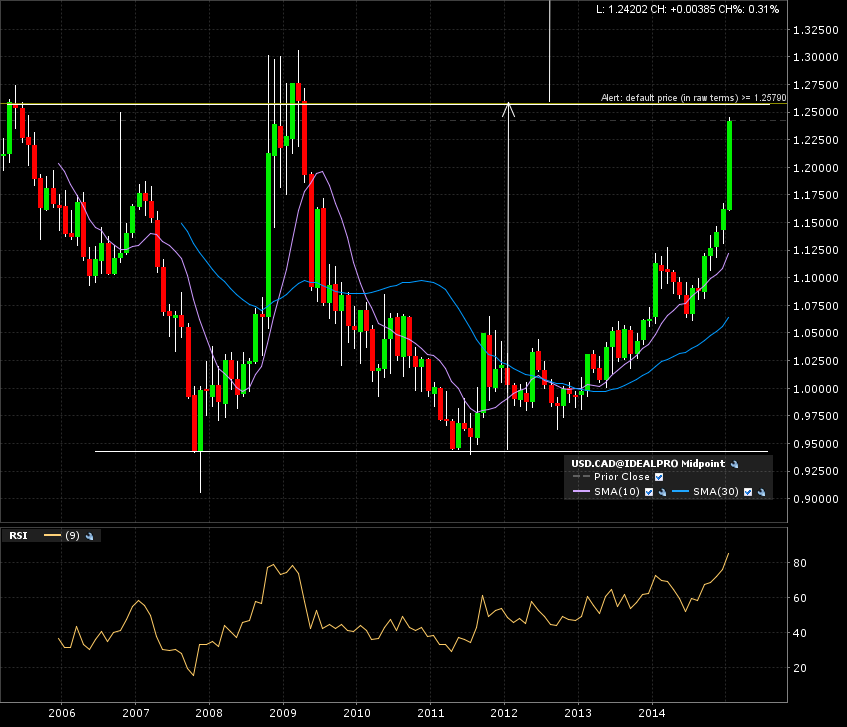
Let’s zoom out a little to the weekly candle chart (5years). A little better. We can the base that the currency pair broke out of. But is that the real base? Could this be a launching of a “bigger” base?
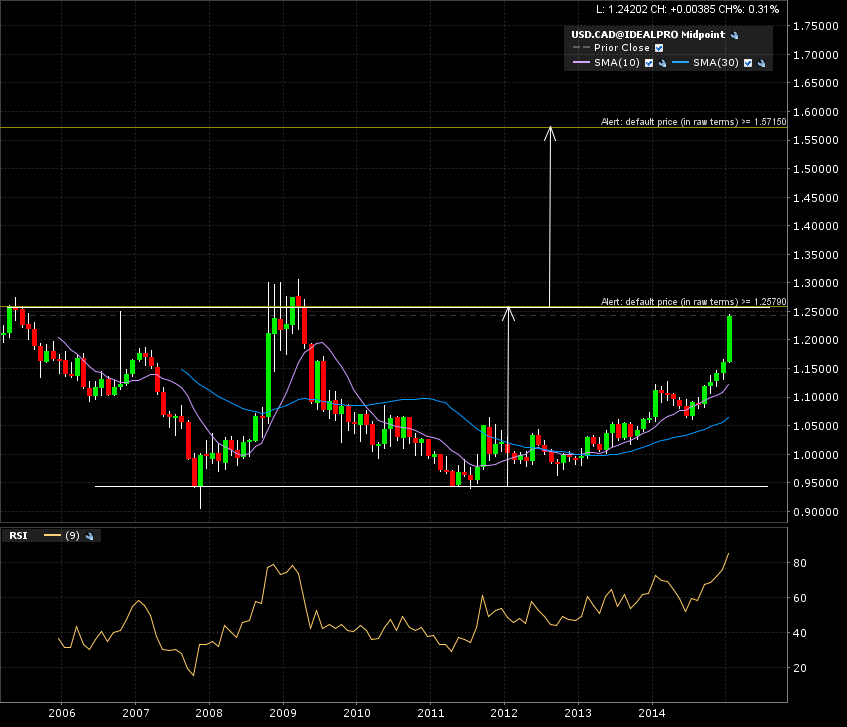
Only one way to find out, the monthly candle 10 year chart. Yep indeed that was just half of the “bigger” 10 year base. The pair is currently on path to test that 10 year resistance line around the 1.25 mark. That is my next play.
I set an alert at that level. Hopefully, I’ll get a smaller classical chart pattern consolidating the price action around that level. The eventual breakout, IF it breakouts, will give me a target way up at 1.57
That looks or sounds crazy, right? Who knows? Well the market knows and that reflects on the price action. That is the ONLY thing that matters, NOT the reason why!