This currency pair is testing some solid support at the 1.500-1.4800 area.
Lets look at what might transpire from an eventual failure of that support.
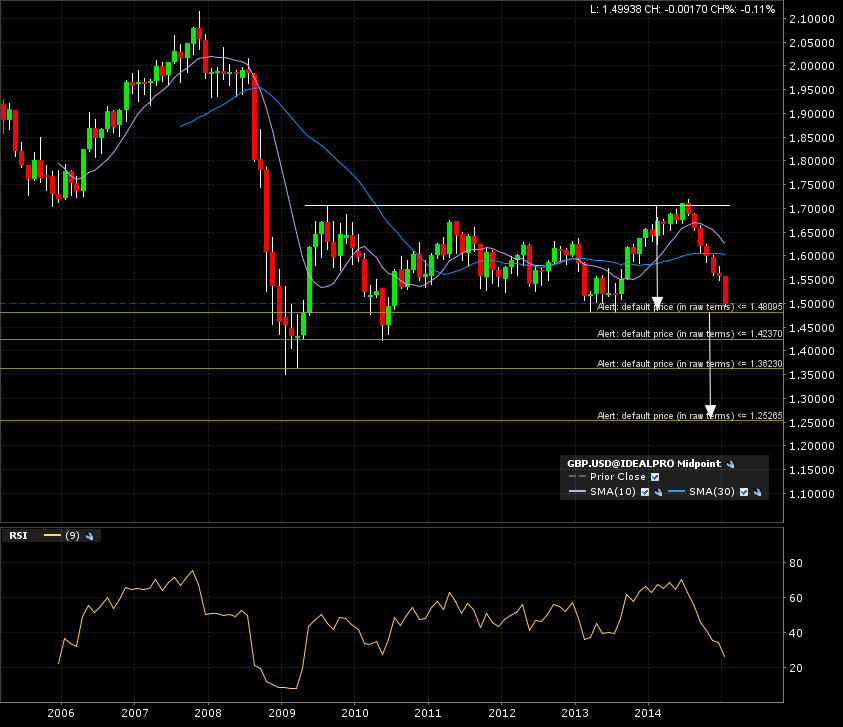
Here is the monthly candle chart (10 years). The arrow would be the measured move added to the breakout line in case of a solid monthly close under it.
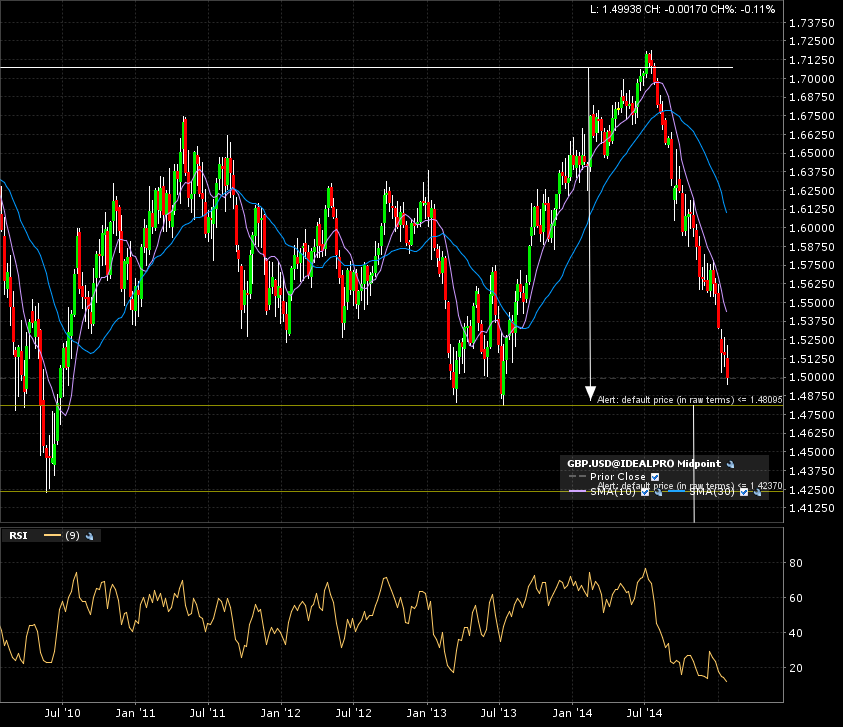
The weekly candle chart (5 years) shows us that the closest nearby support is at 1.48, which the pair is inching towards testing it.
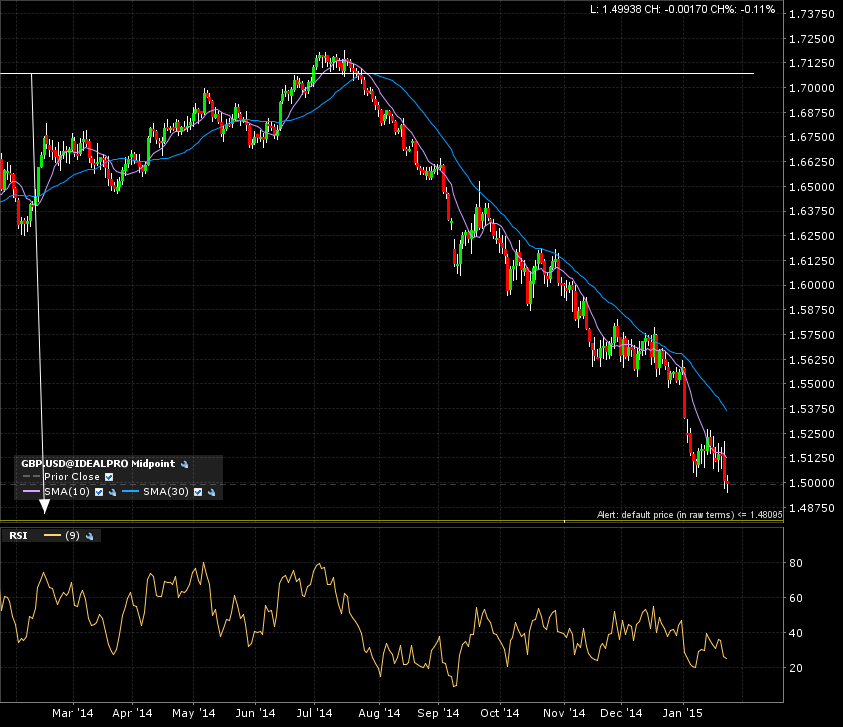
The daily candle (1 year) shows us the 7 month descending channel.
Overall, this would be a very solid play. But I can’t give it an A+ grade because of that support which might hinder it’s march towards the 1.26 target. Go take a look back at the monthly chart for the 1.42 and 1.36 alerts I set for reference.
Let’s start by waiting to see if it actually breaks down.