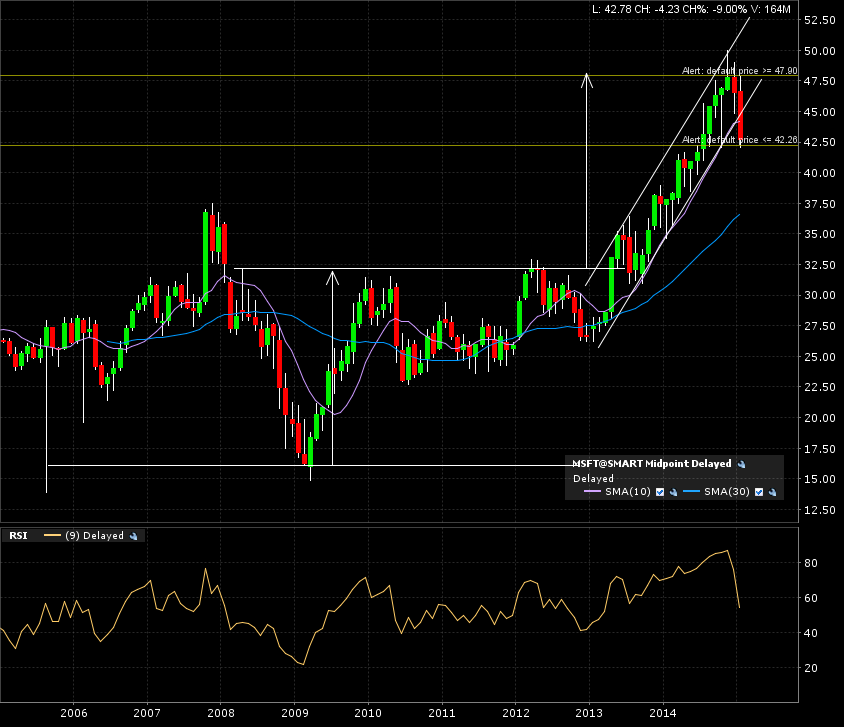
Here is the action for Microsoft for the past 10 years. After a 5 year bottom formation, the stock broke out in early 2013 and has been on a bull run through a nice ascending channel… till now. Check out the monthly candle 10 year chart.
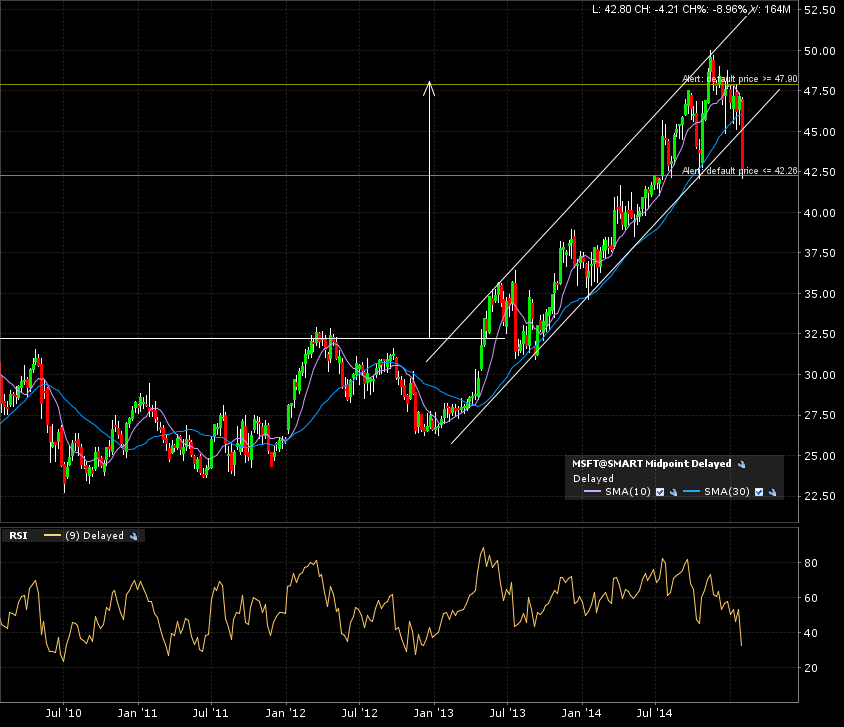
Zooming in on the weekly candle 5 year chart, the ascending channel is morphing into possibly a:
- Top formation with a breakdown line around the 42 mark (support). OR
- Continuation formation with a breakout at the previous resistance around the 49-50 mark.
Then again, this could morph into something else, I can’t tell the future, just act on what I see right now.
Let’s move on to the daily candle chart (1 year). We can clearly see the gap down out of the ascending channel formation.
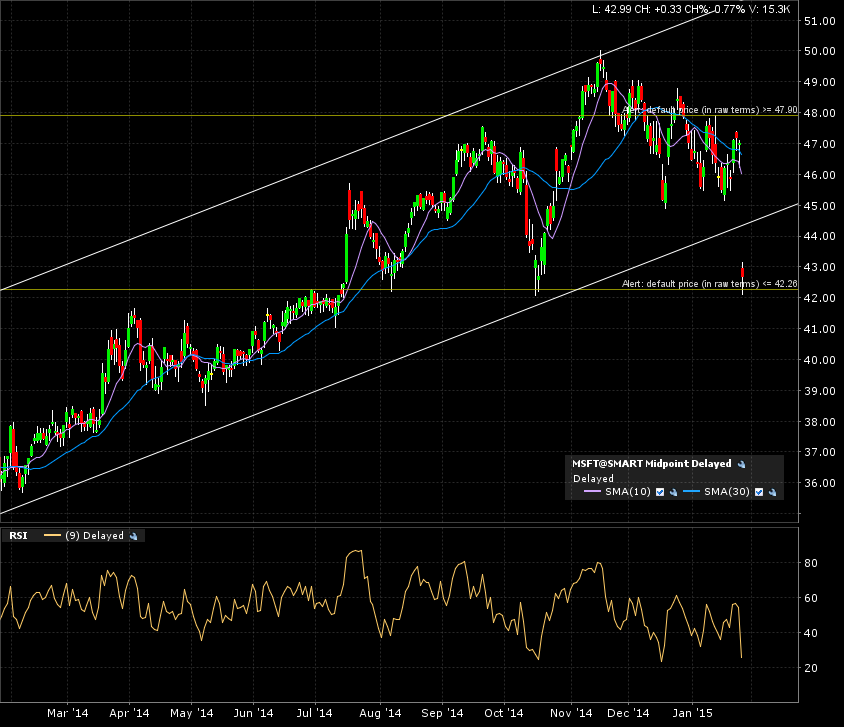
Right now, I set some alerts at that support and resistance. Will let this cook for a while and see what the market does with it.
Hope it taste good!