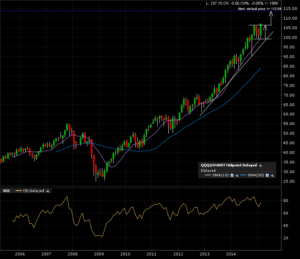
QQQ has been on a rampage since those early 2009 lows. Check the monthly candle 10 year chart. A small 4 month consolidation pattern is being resolved.
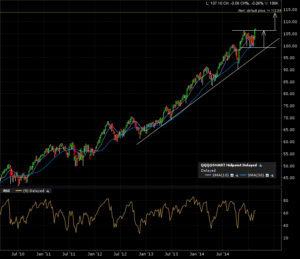
For a small pattern, we need to zoom in on the weekly candle chart (5 years) to get some more detail.
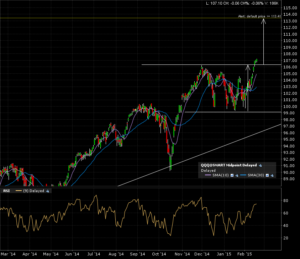
Here is the price action on the daily candle 1 year chart. The arrow is the implied measured move added to the breakout line.
Need to wait for the monthly candle close above the breakout line at the 106 mark. IF it does close above, the target is 113.


