This company (fsz.ca) was brought to my attention by a friend of mine. Don’t know much about it and don’t really care.
The most important thing for me is the price action, classical chart patterns for establishing entry and exits, and respecting my risk and money management protocols. The rest is noise. Go look at my “How To” for details.
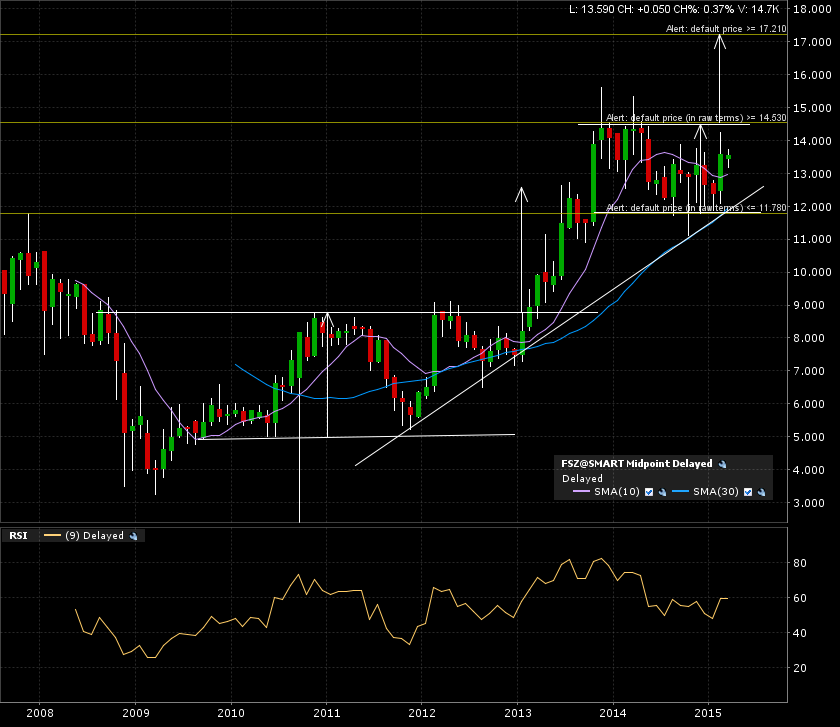
Here is the monthly candle chart dating back to late 2007. First target was reached after breaking out in early 2013.
Right now in progress of a +1 year consolidation pattern.
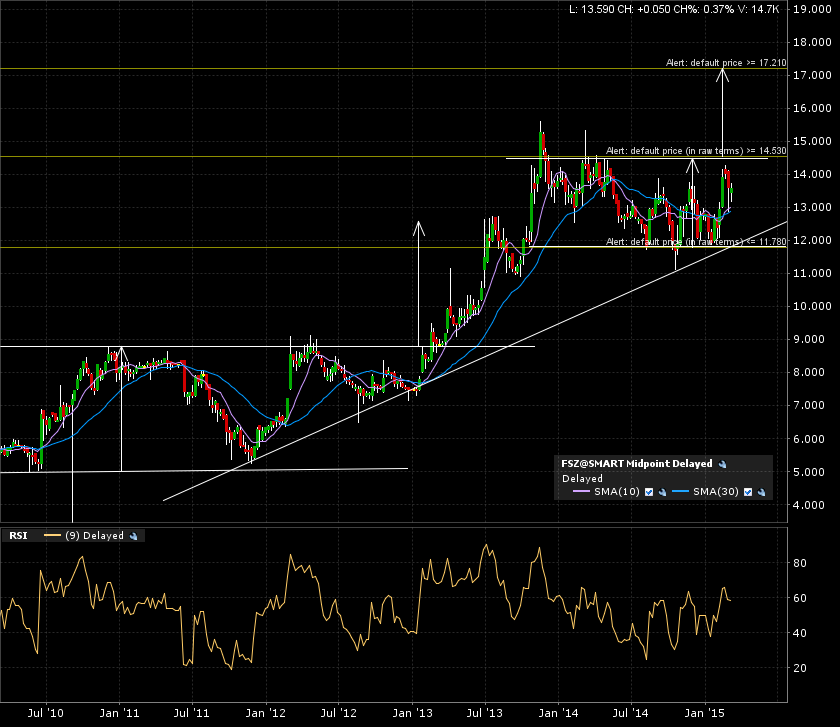
The arrows are the implied measured moves added to the breakout lines. The weekly candle chart (5 years) shows the bounce of the current consolidation pattern on the ascending trend line.
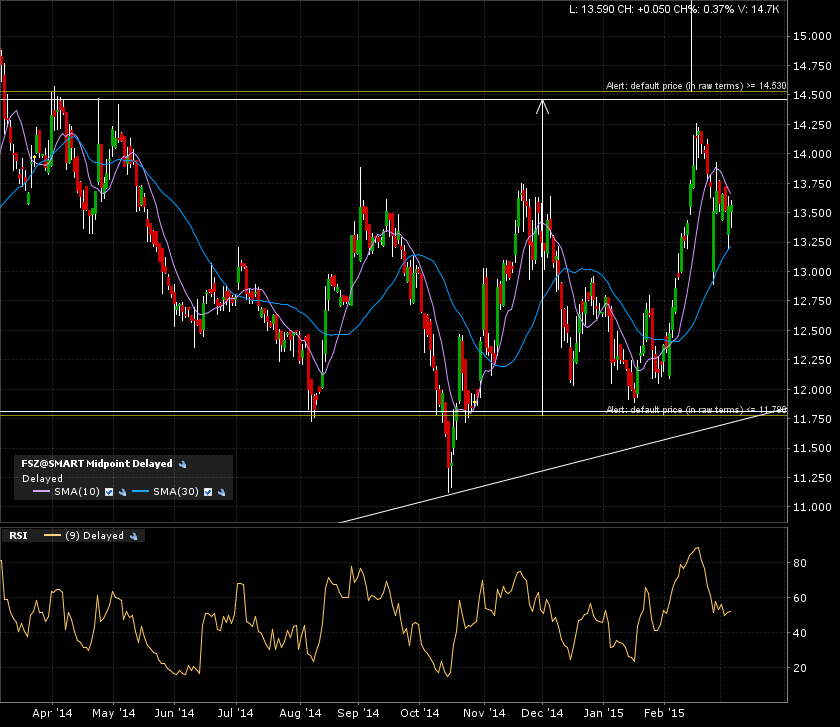
Zoom in on the daily candle 1 year chart. Price action still in no man’s land.
This is a case of setting an alert and waiting for it to get triggered. A monthly candle close above 14.50 will confirm the continuation breakout. Target would become 17.25.
Need help with patience. check this previous post out.
See you later Fiera Corp!