Check this previous post from Jan 12. Here we are +2 moths later. Let’s see where CGI group Inc. (NYSE:GIB) is at today.
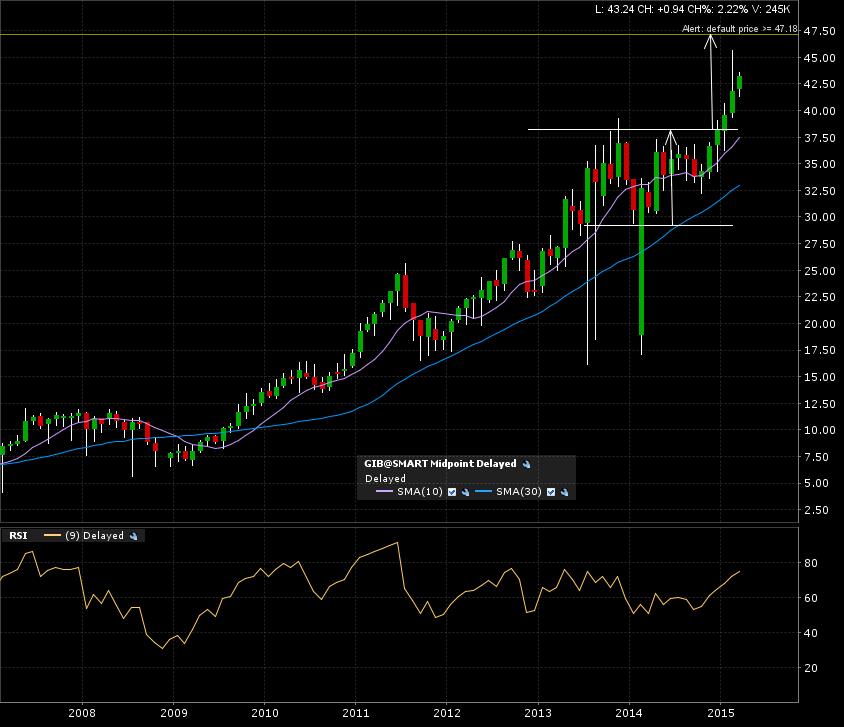
Enter the monthly candle chart (8 years). Breakout confirmed. Valid target of 47.50.
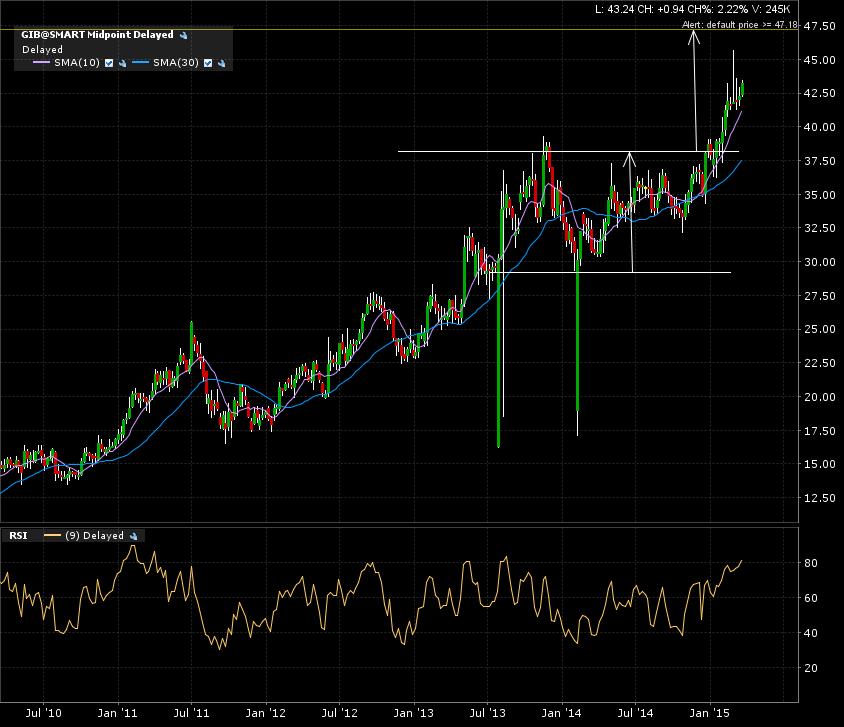
Here is the weekly chart. Etching close and closer.
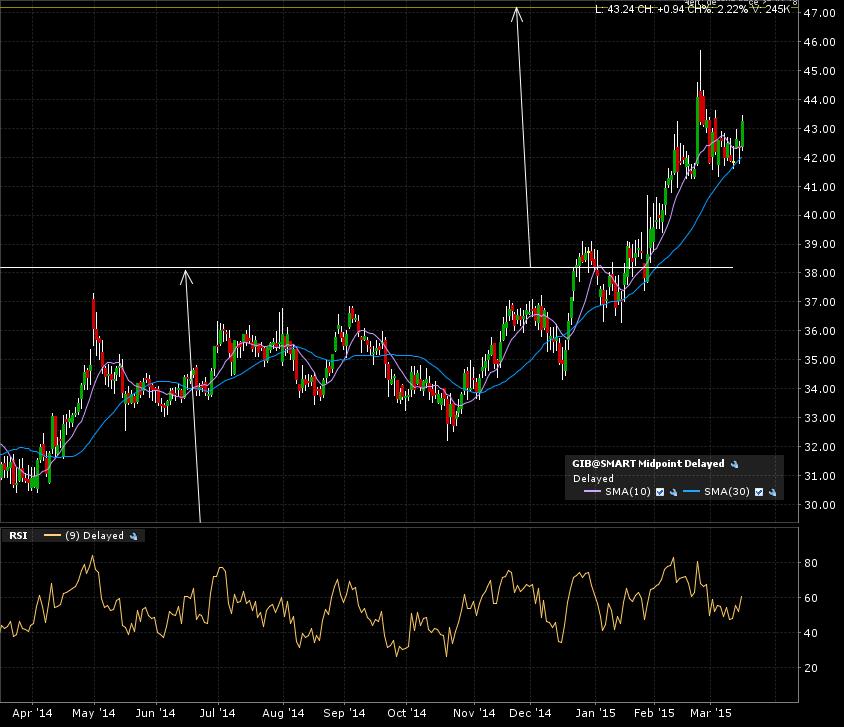
Zoom on the daily chart (1 year) shows some turbulence (noise) on the way to target.
That’s about it for CGI. See you at target! Well, again, NOBODY knows the future, so make sure your position sizing corresponds to sound risk and money management protocols. I’m more often wrong than right, but because of skewed risk to reward ratios in my favor, I don’t have to! See my “How To” for additional information.