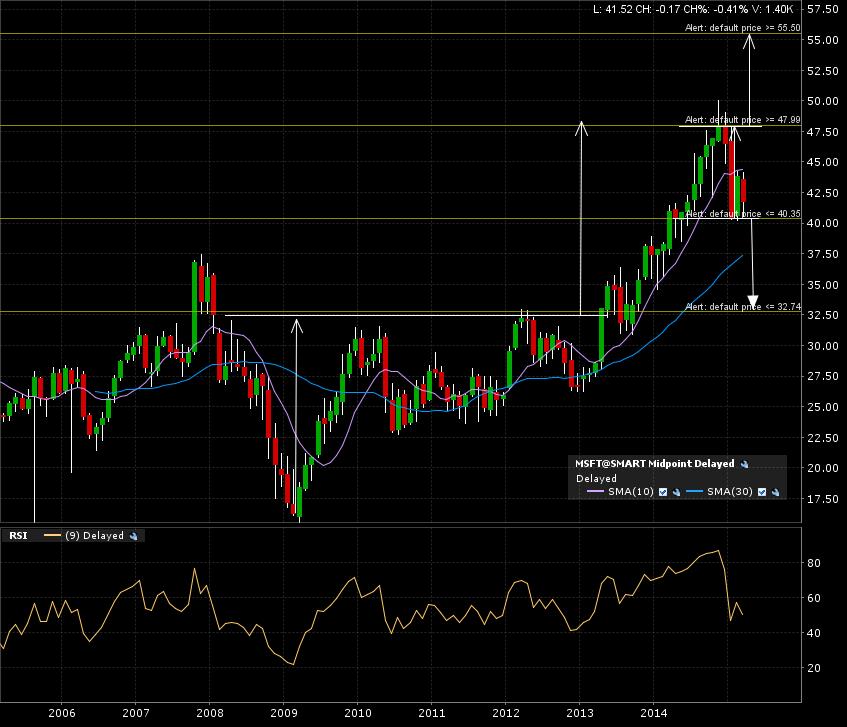
Wrote a post on Microsoft Jan. 28 after a BIG gap down. Here is the link. A support line is being traced on the 40 level. The monthly candle 10 year chart is showing the carving out process of a top formation. The arrows are the implied measured moves added to the breakout lines.
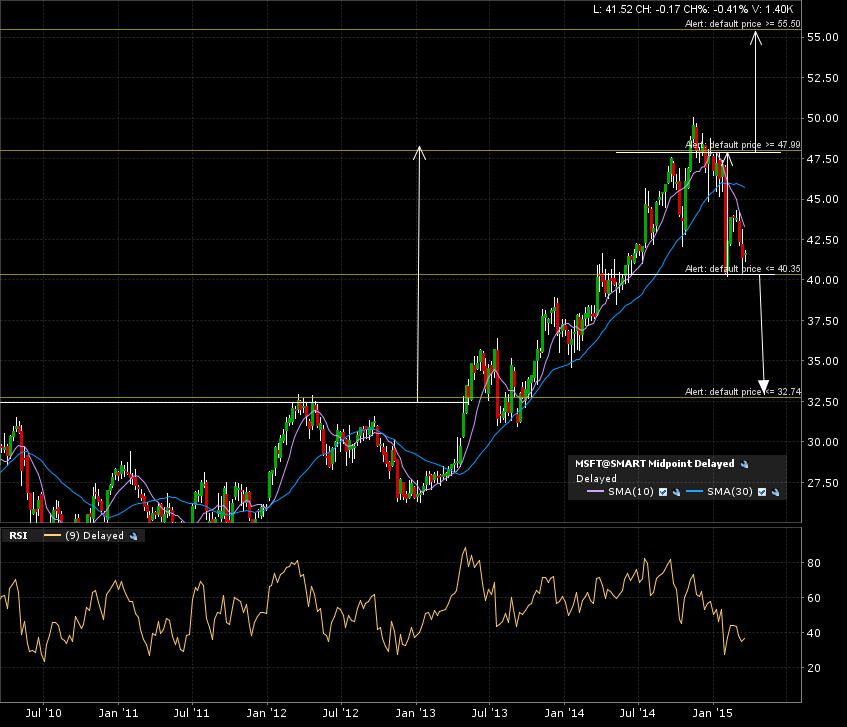
The weekly candle 5 year chart shows the two cases, bullish and bearish. Right now, we are closer to testing the bearish case for Microsoft.
Zoom in on the daily candle 1 year shows us the price action testing the important breakdown line.
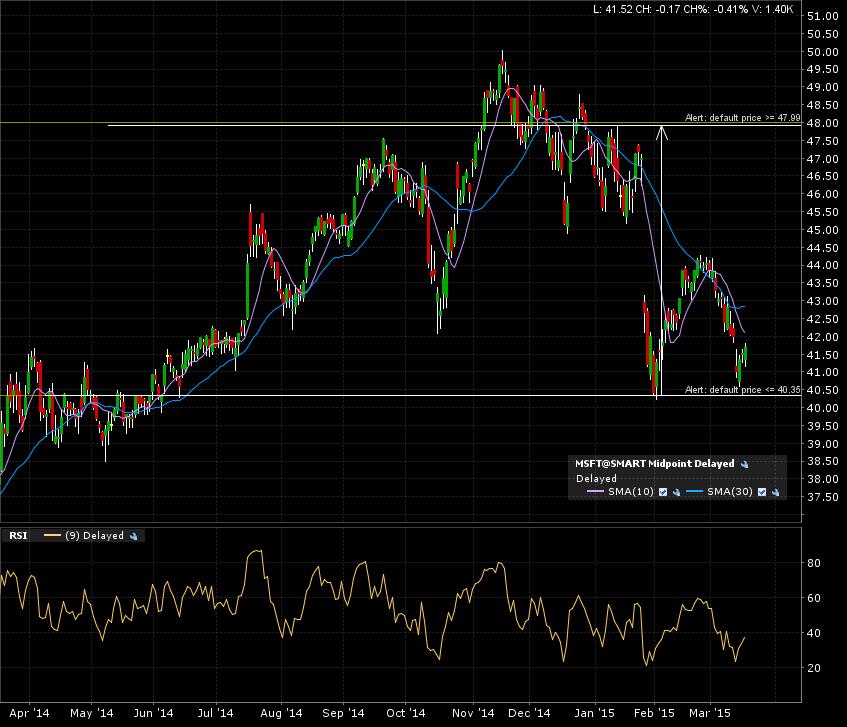
My alerts are set. I’ll get back to this when one is triggered. Some more cooking might be needed before a breakdown OR an eventual breakout, either way, I’ll be ready!