After reading JC Parets last post on FXI, I couldn’t help but notice that rising wedge formation.
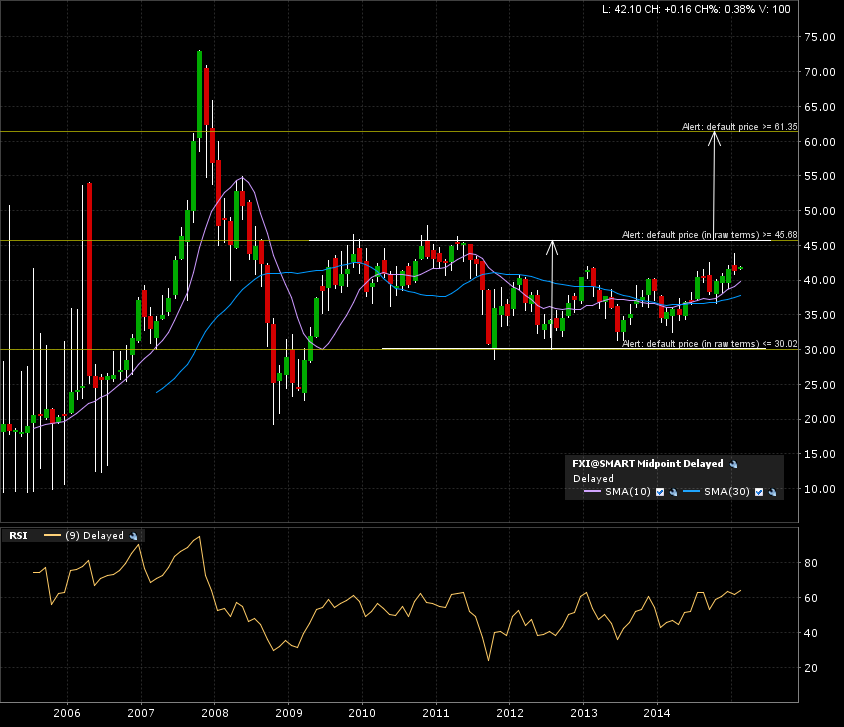
First off, lets look at the 10 year monthly candle chart. I’m seeing a 6 year consolidation rectangle in progress. A test of the top line (resistance) is close to happening. A convincing monthly candle close above the 46 would indicate an implied measured move to 61.
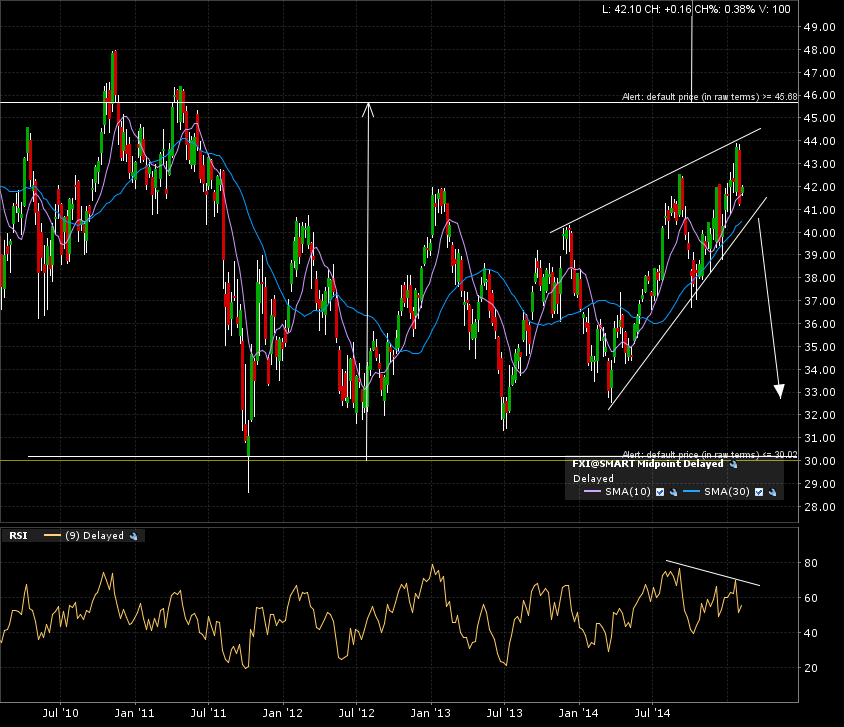
Now, for that rising wedge (reversal) formation. Check out the weekly candle 5 year chart. The measured move of a completed rising wedge formation is indicated by the downwards slightly slanted arrow (back to the base of the formation). Another tell-tell sign is the bearish divergence with the RSI. We still have to wait for this formation to resolve by breaking down.
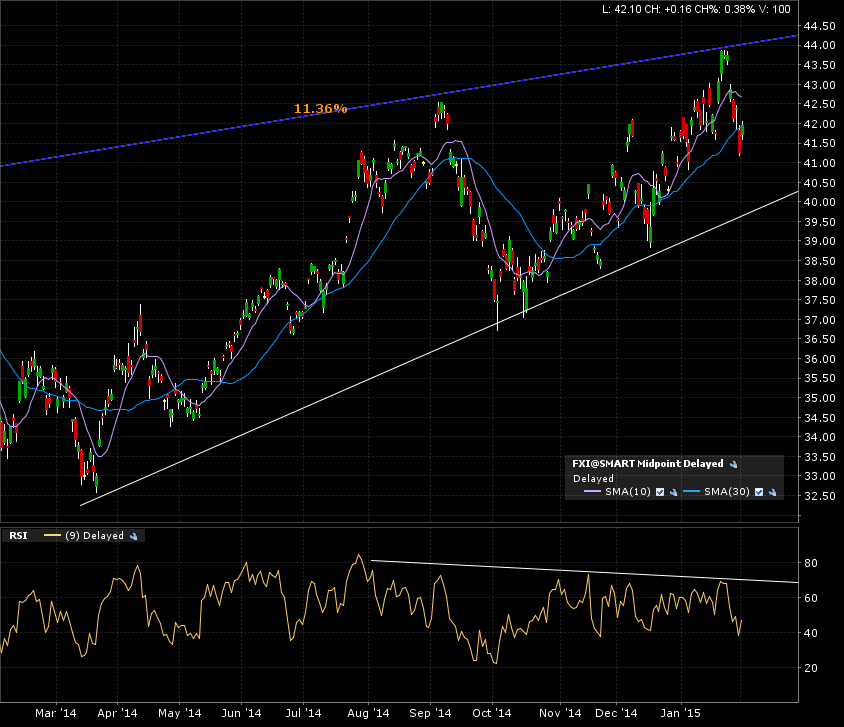
Zooming in on the daily candle chart (1 year) for some more detail of the price action. No man’s land = wait.
Again, this is a waiting game. That huge consolidation will make for a strong move once broken, either to the top or bottom side. Easiest is to so set some alerts and wait a little. Once triggered, I’ll come back and analyse the risk to reward, to see if it lines up with my risk and money management protocols.