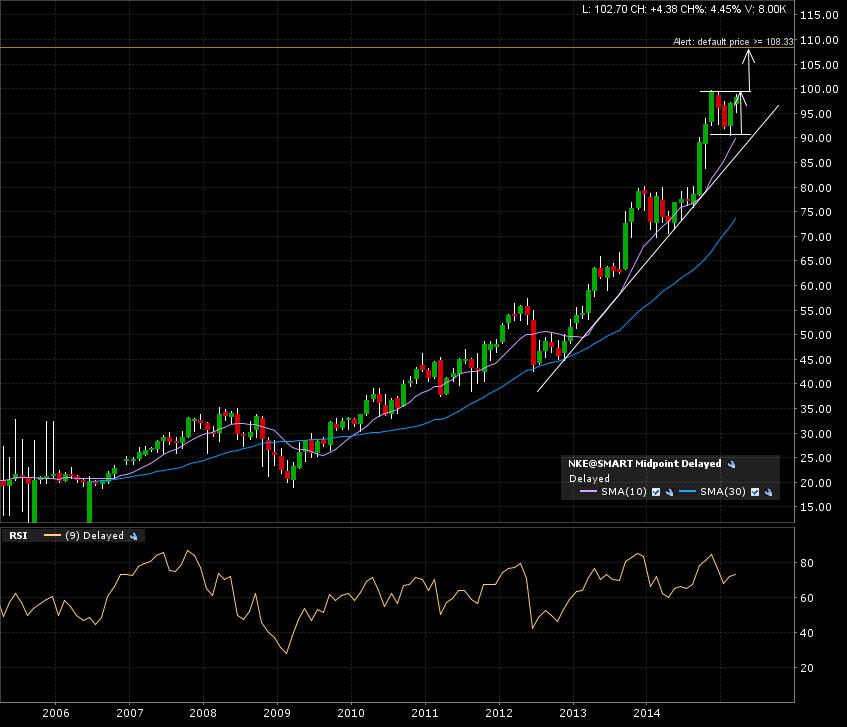
Nike (NKE:NYSE) has been running uphill at a fast pace. Has been consolidating for the past 5 months. Is it ready for a next leg up? Let’s check the 10 year monthly candle chart to start. Ascending trend line still valid. The arrows are the implied measured move added to the breakout line.
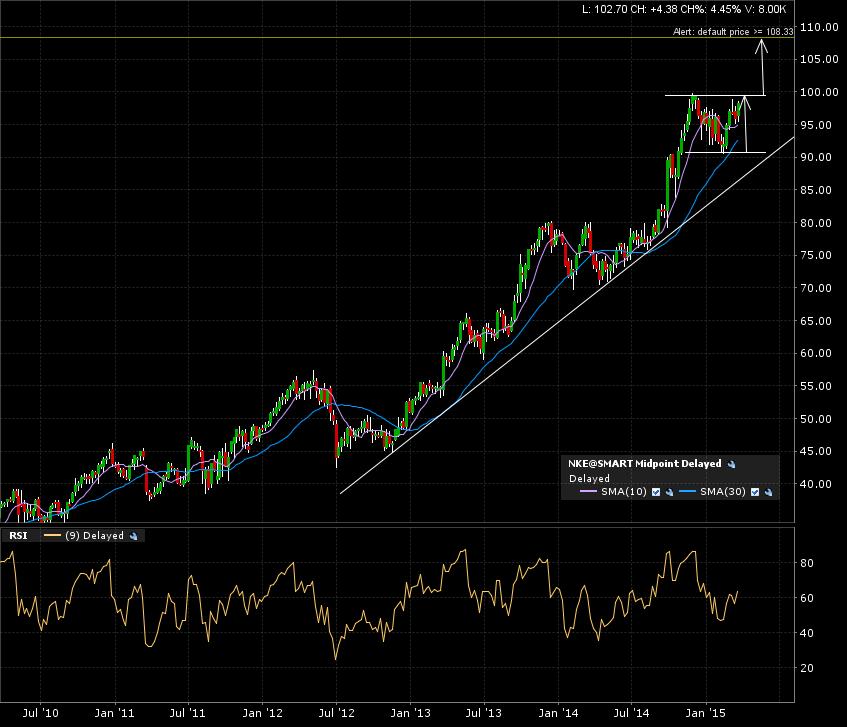
Here is the weekly candle chart (5 years). Test in progress on the 100 level (resistance and breakout line).
Zoom in on the daily action. Closing in on the breakout line. Multiple test of the line.

I set an alert at 100. A monthly candle close above and this would confirm the continuation breakout to 108.
Those shoes might just still got some miles left on them after all!