Biotech Novavax Inc. getting some attention recently.
What is getting my attention is that this chart is breaking out of a HUGE +8 year base. Check the monthly candle 10 year chart for nvax. The implied measured move is added to the horizontal breakout line.
There was a breakout of the slanted trend line last month, but I prefer playing horizontal breaks. I believe they add value to the setup and the following breakout move.

The 5 year weekly candle chart shows the step for both breakouts. Not much noise here. A+ material.

The zoom in on the 1 year daily candle chart shows a pullback after the last breakout. Not unexpected.
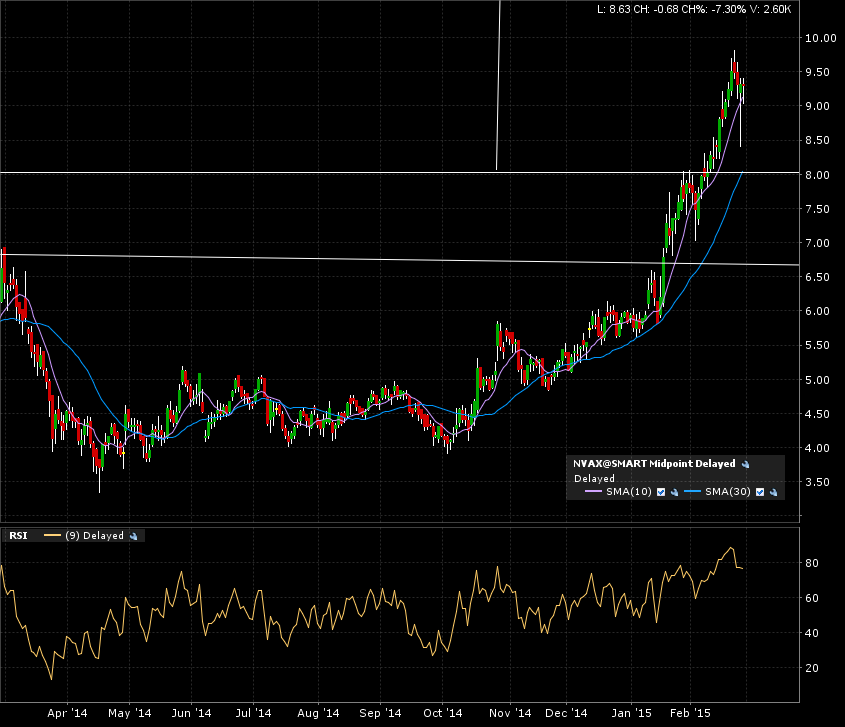
The target is the 15 mark. If your are not already in, and the monthly candle has a convincing close above the 8 level, this could be an opportunity to enter.
Remember to use sound risk and money management protocols with all your trades. Time to go check my “How To”.