Check out this huge multi-year descending triangle classic chart pattern for eurgbp. The implied measured move from the breakdown line would give us a target way below at 0.6750.
Here is eurgbp on the 10 year chart with monthly candles:
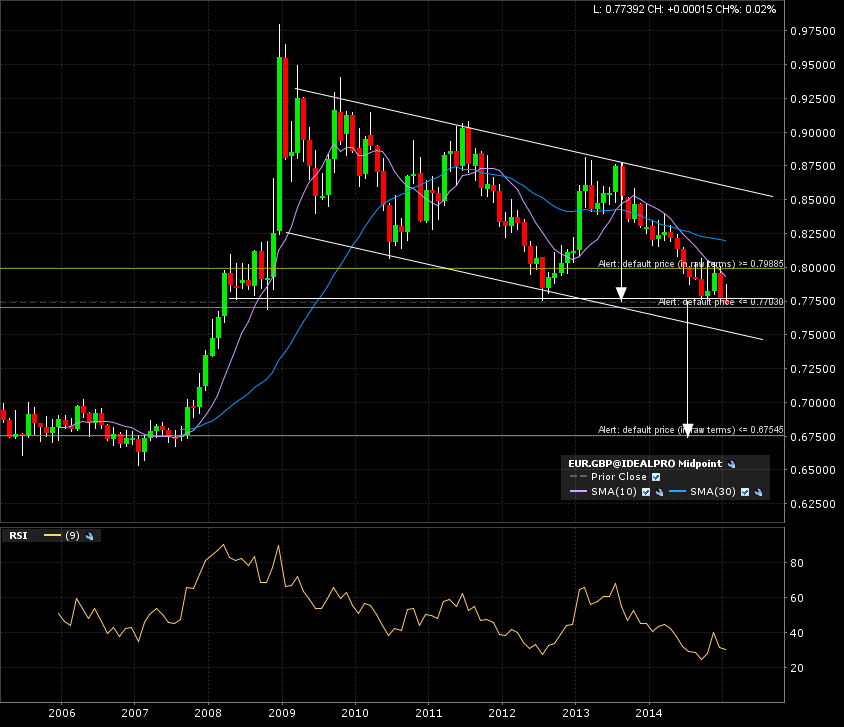
Notice the lower channel line, this might serve as support and an eventual bounce back to upper channel line.
Here is another case where a channel boundary can be a huge warning sign that the read on the implied measured move might not be a right “fit”.
This would not be an A+ chart setup.
Let’s look closer on the weekly candle chart:
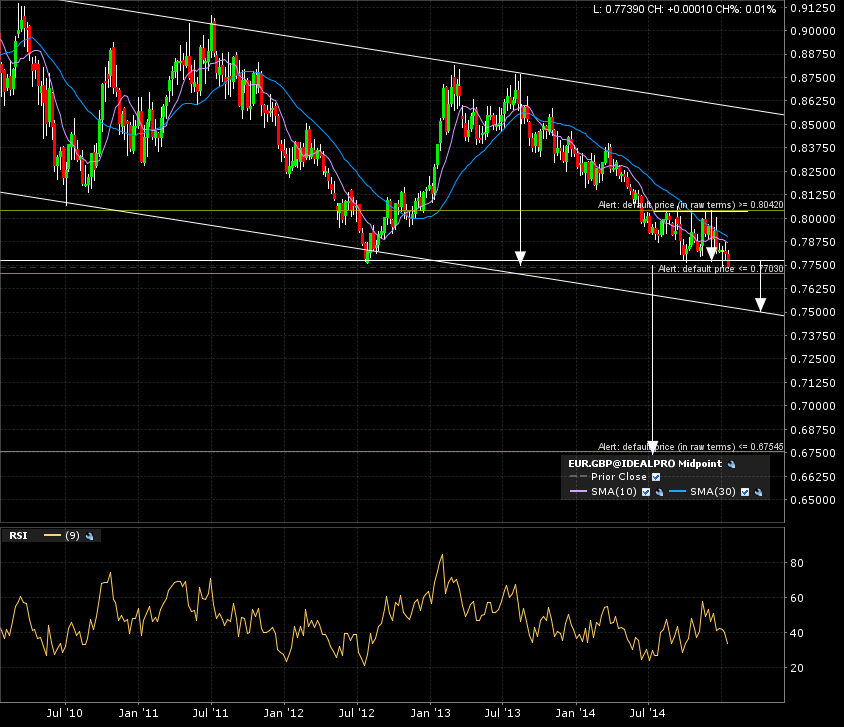
We have a shorter term bearish rectangle in progress. The implied measured move for that classical chart pattern would bring us over time to coincide with that lower line of the descending channel.
This is a possible play. Not an A+ since points are lost for the shorter time frame base.
Here is the daily candle chart:
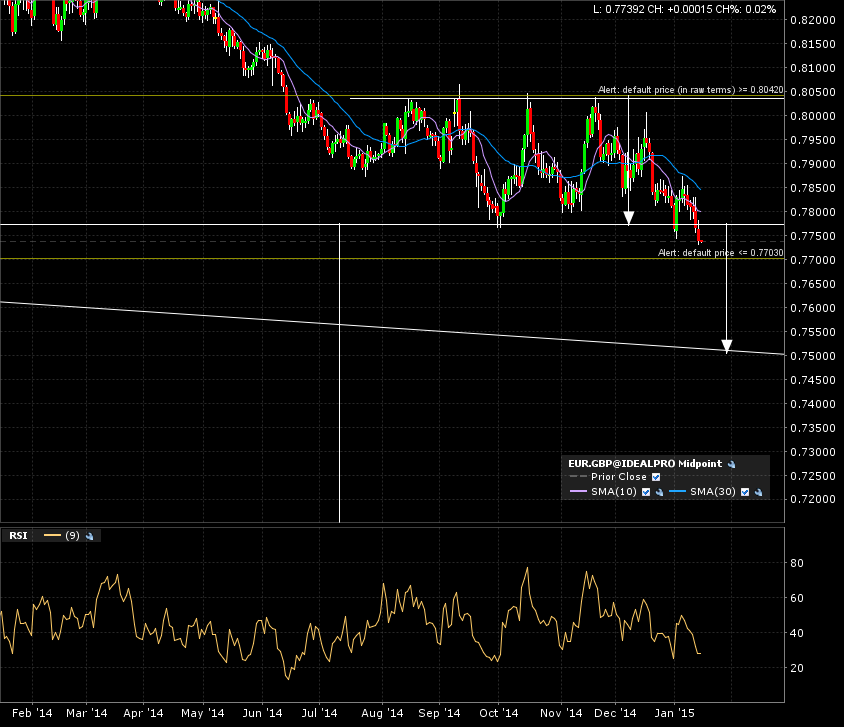
We cans see the breakdown is already in progress. The “micro” view shows he descending channel lower limit coincide with the bearish rectangle target.
This would be the first target. I can always re evaluate after the position plays out.
If this Friday’s close remains below the breakdown mark, I’ll have to parse the entry and exits points with my risk and money management protocols.
Will follow up this weekend…