I use classical charting principles to dictate the implied measured move the price action will take when the breakout is confirmed.
Before opening the position, I’ll also look for eventual horizontal resistance lines from previous peeks or valleys that my implied move will have to go through to reach its target.
Here is the Amazon with monthly candles on the 10 year charts to demonstrate:
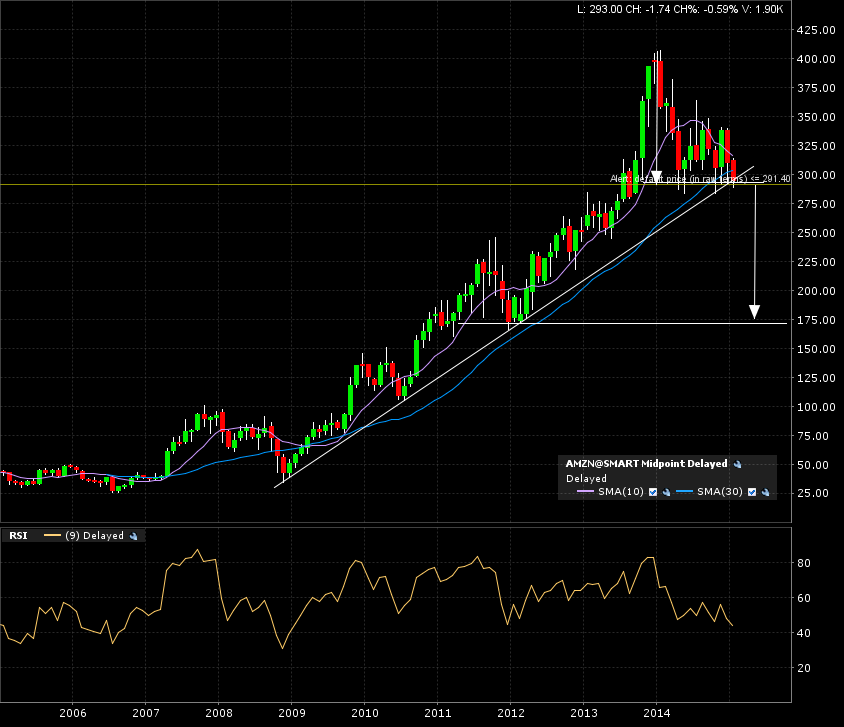
I’ll consider shorting Amazon if a monthly close below the horizontal line around the 290 level.
The measure move would bring me a target of 175. If the ri:re (risk to reward) is acceptable within my risk management protocols, I’ll then look for important resistance of support along the way.
This will help me separate A+ positions from B+. I believe this will increase the probability to reach my target.
For a closer look, here is the weekly candle 5 year chart:
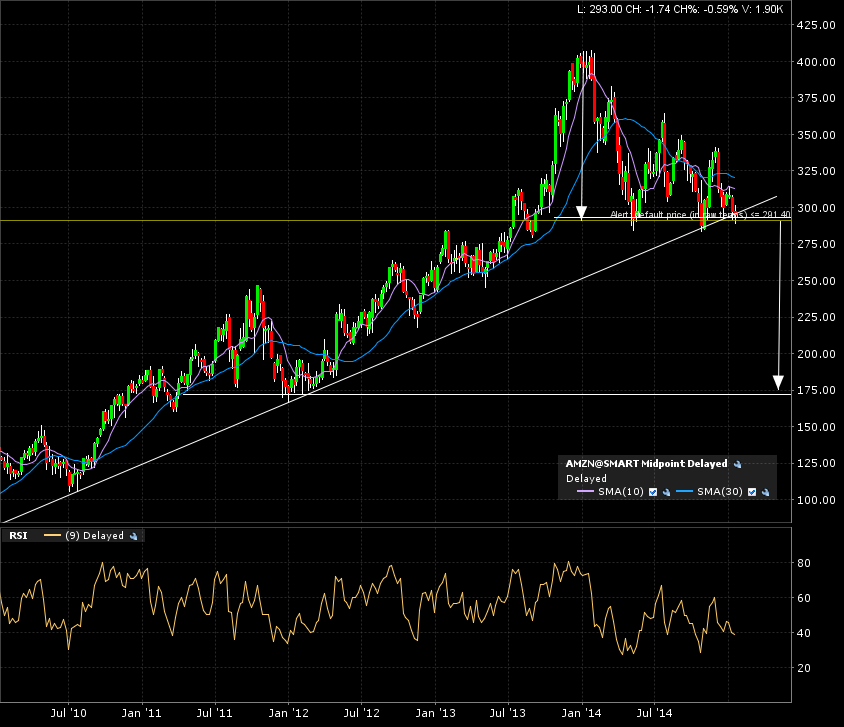
In this case, the coast is clear to the implied target. The next strong support to be reached coincides with the target. This would be a A+ position to open.
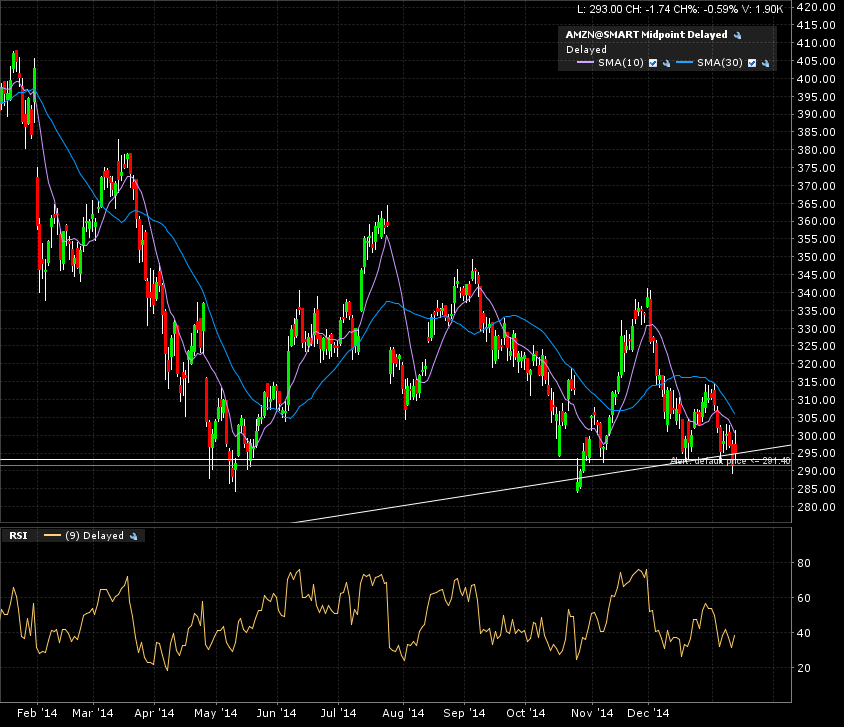
Finally, the daily candle chart (1 year):
Hope this helps you select A+ from B+ chart setups!