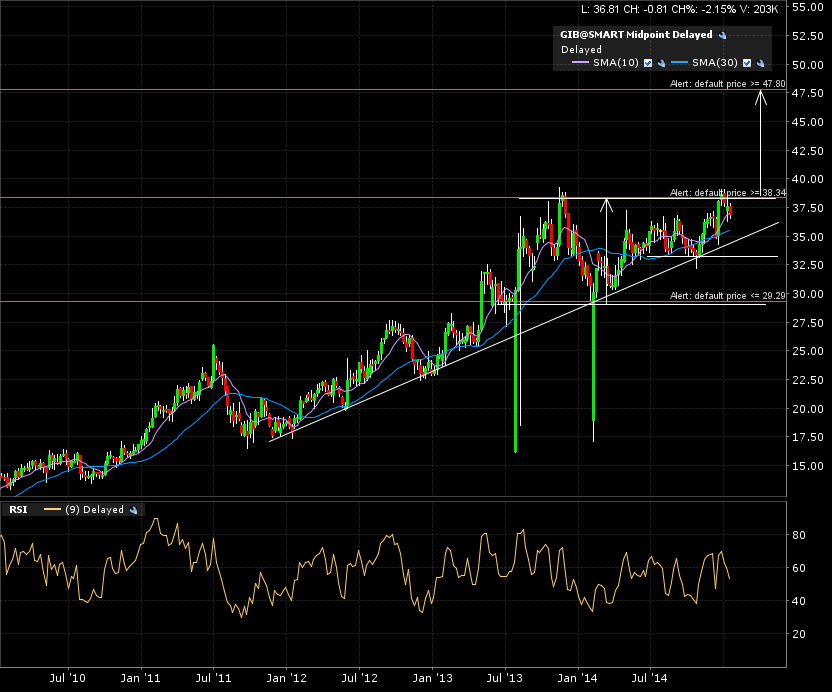
CGI group Inc. (NYSE:GIB) has been testing/consolidating near some major resistance around the 38 mark since mid 2013 (over a year and a half).
Here is the monthly candle chart since 2007:

A closer look at the weekly candle chart (5 years):
And finally 1 year action with daily candles:
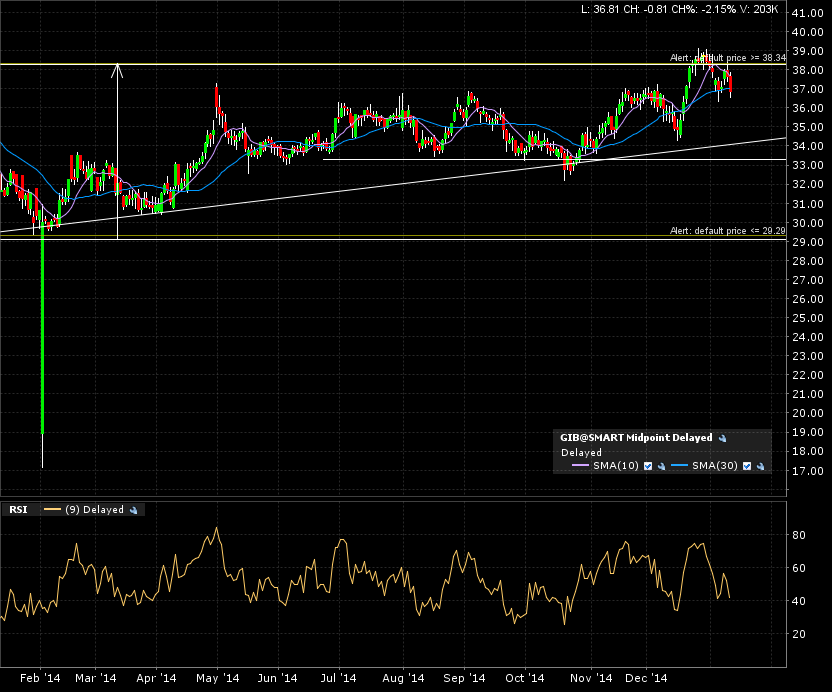
My alerts are set. I’ll keep watching this closely for a decisive close on the monthly candle chart above 38.50.
Immediate target would then be a measured move to 47.80.