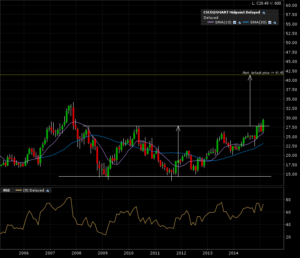
Here goes Cisco on a new bullish adventure. HUGE 7 year base formation is currently breaking out of. Check the monthly candle 10 year chart. The arrows are the implied measured move added to the breakout line.
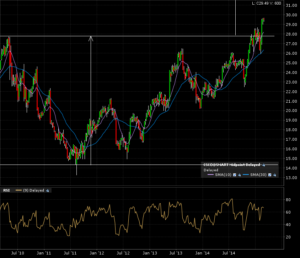
Zoom in on the weekly candle 5 year chart and notice the price action noise around the breakout line. Some whipsaws there could hurt your bottom line.
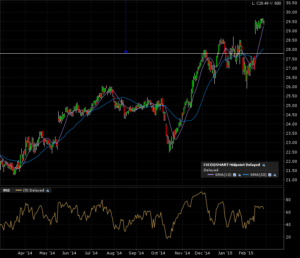
And the daily candle 1 year chart. So much noise there my ears hurt, and so could of my Net Asset Value.
Remember this important noise reduction tutorial using monthly candles. Those weekly and daily candle chart whipsaws would of been avoided.
The A+ setup is happening now, IF the current monthly candle can close above the 27.50 breakout level.
Couple of days to close the month. The target would be 41.50.


