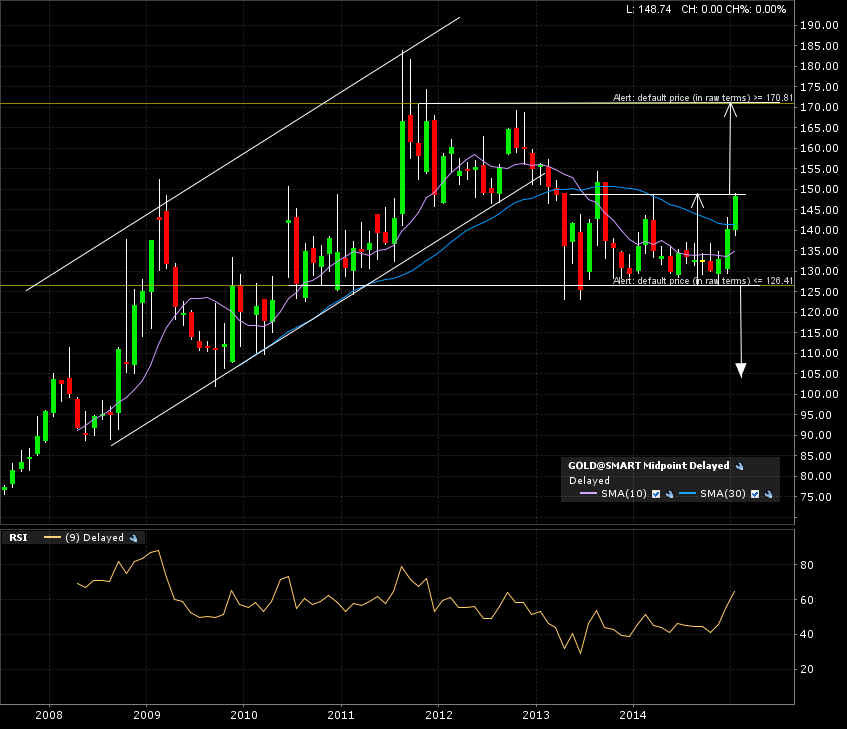
Here we go with physical gold. Check out the actual description link if it fancies you! This chart could of been called Bananas Inc., all I care about is the price action, not the underlying asset.
The monthly candle chart has been nicely consolidating for 2 years after rupture of the ascending channel.
The implied measured moves are showed with the arrows.
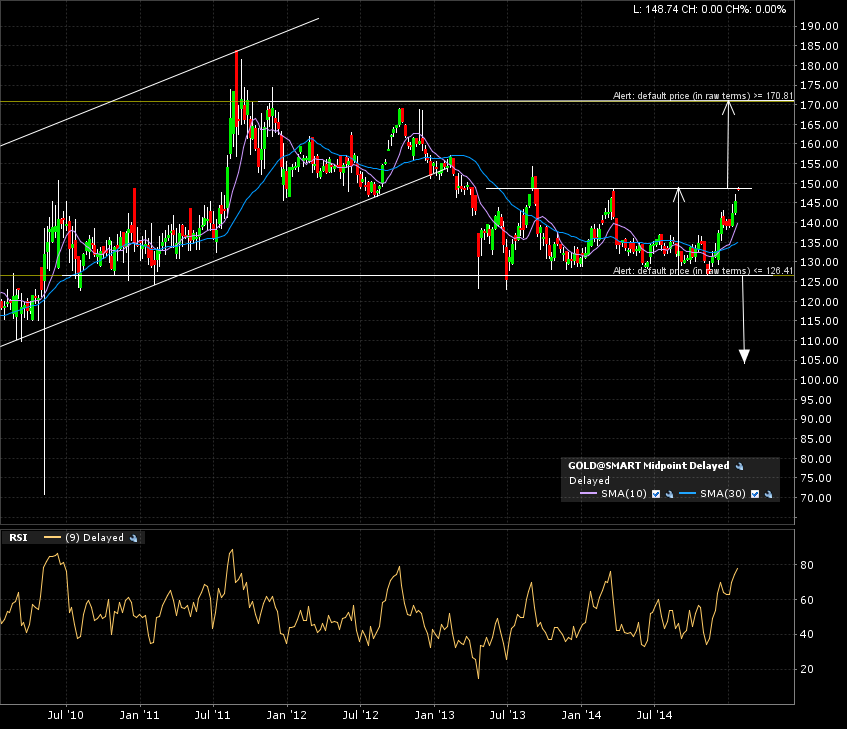
The weekly candle chart shows us a test of the upper boundary of that rectangle.
We can actually see a gap up on the daily chart. Can this be an exhaustion gap? Checkout this chart school link in gap analysis.
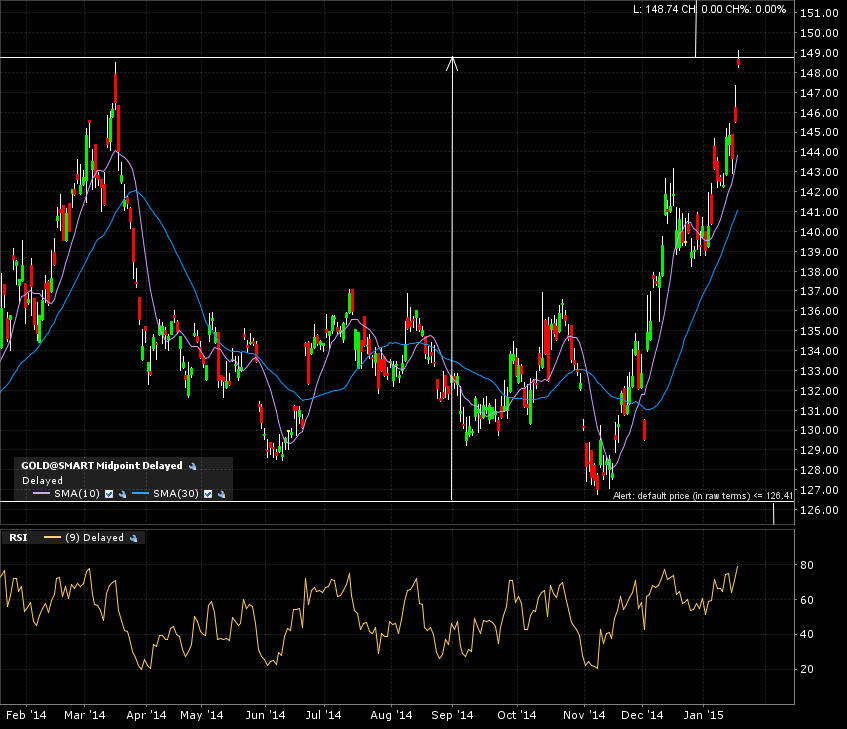
Again, I’m going to wait for a monthly close above that upper boundary line before pulling the trigger.