Here is the second part after much time has passed from this original post from feb 8 on the gbpnzd forex pair. Check it out here. The breakout was confirmed and the price action is closing on the target at 2.43. Here is the monthly candle chart.
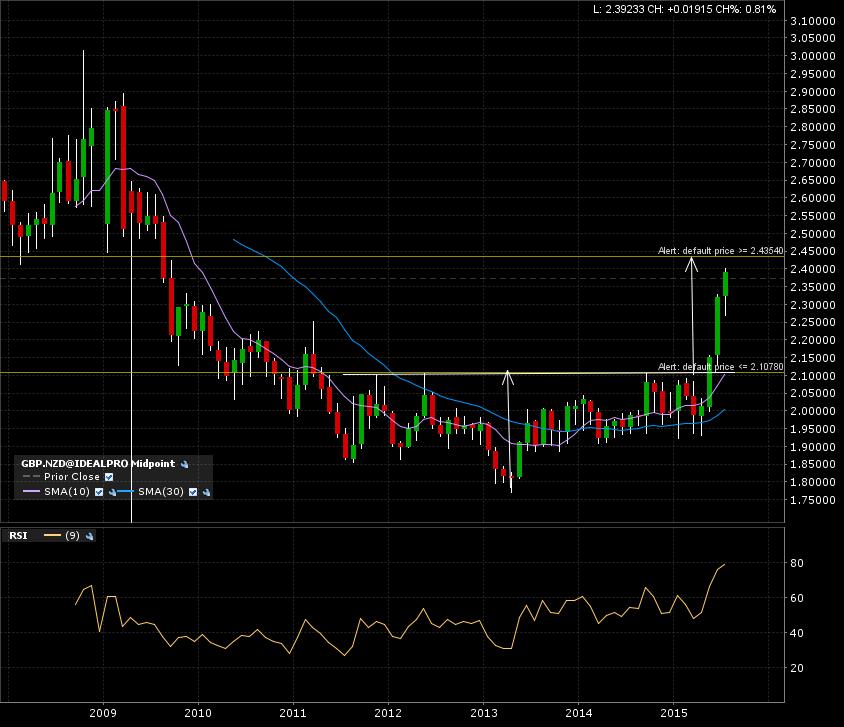
The 5 year weekly candle chart shows the fast move after the breakout. These are what I consider A+ moves. As the saying goes. the larger the base, the higher in space!
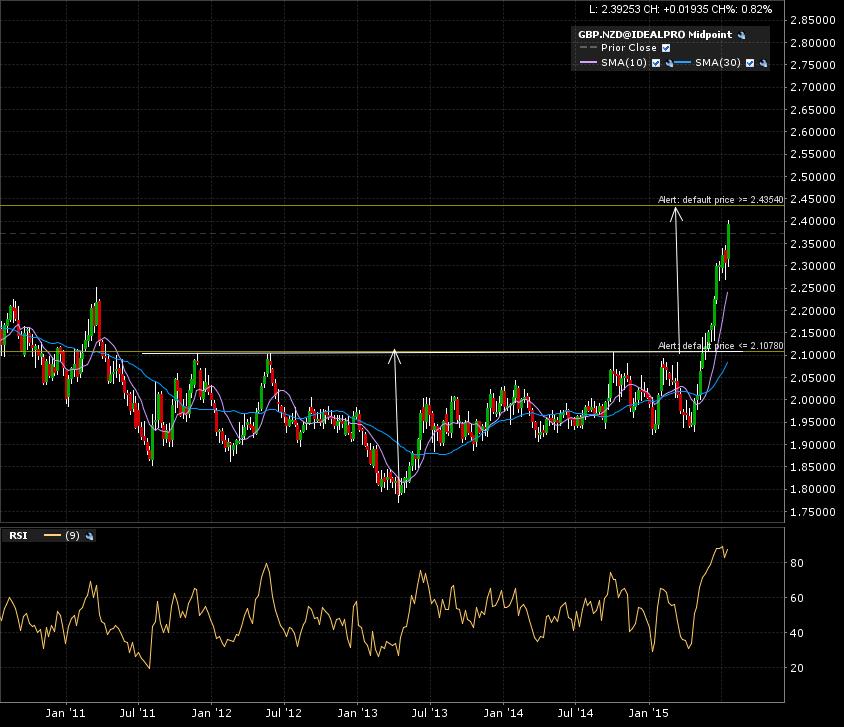
Zoom in on the 1 year daily candle chart. Picture perfect!

There you go I will wait till this consolidates after reaching target for an eventual continuation move. Let’s see what happens!