First, check out one of my previous post on IBM here.
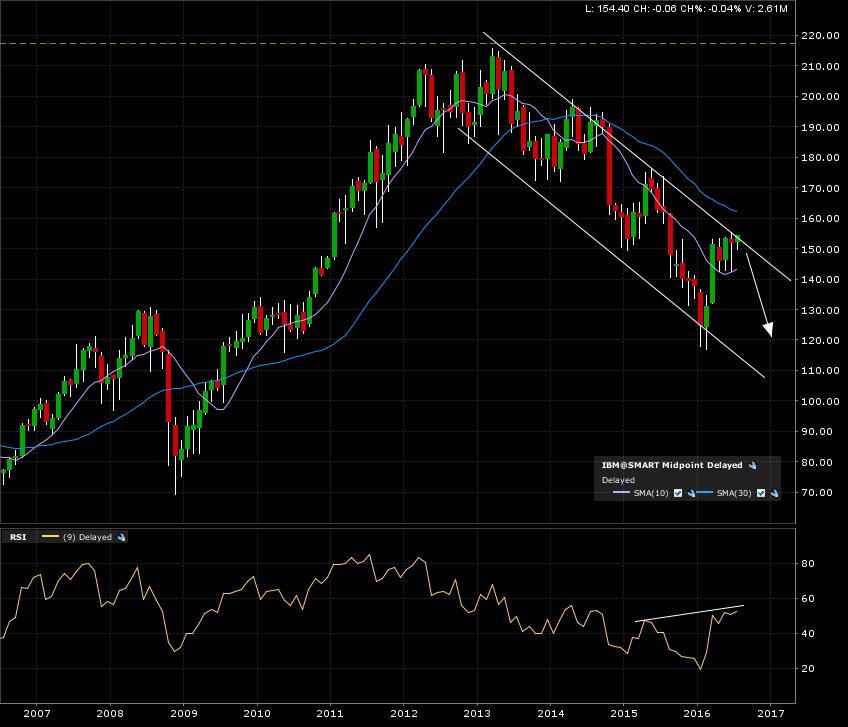
IBM (IBM:NYSE) is testing the top line (resistance) of it’s HUGE descending channel on the monthly candle chart. Bearish divergence with the RSI giving more probablity of the possible bearish move.
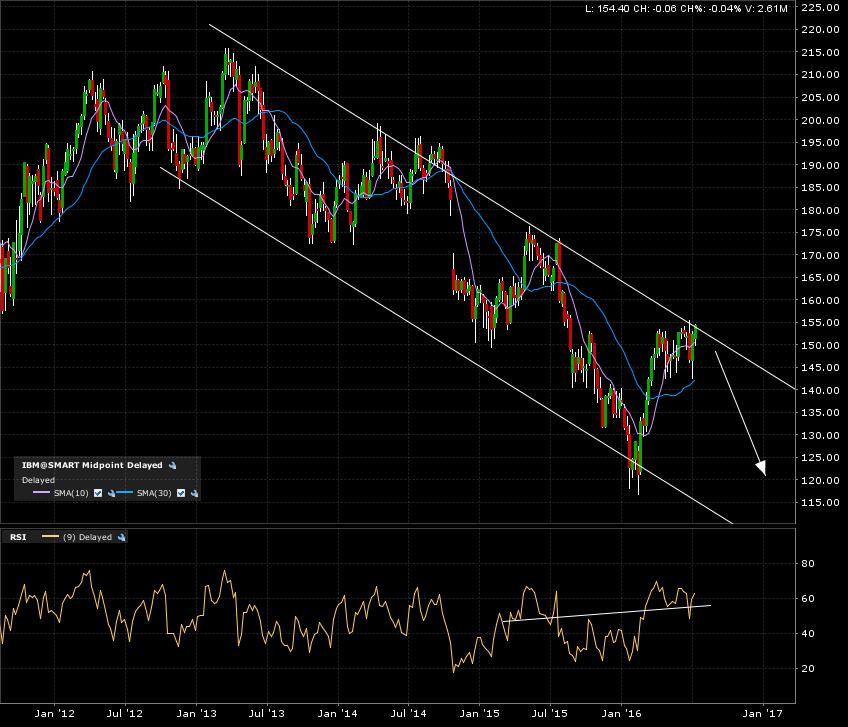
The 5 year weekly candle chart zooms in on that descending channel. Target 120.
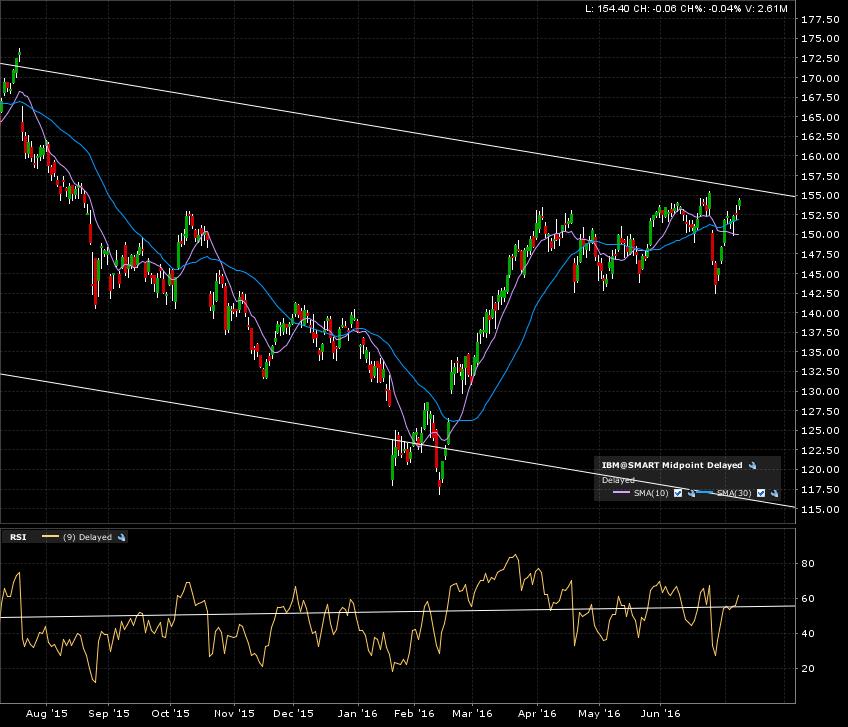
Zoom in on the 1 year daily candle chart shows the price action consolidating near the breaksout line. All bets are off if a close above 155.
I set my alerts and will come back once trigerred. Shorter term could be bullish, but the stronger longer term trend is bearish. Which one do you choose to play?