DIRECTV (DTV:NASDAQ) has been consolidating for the past year and is testing the breakout line at 90. Check out the monthly candle chart.
The 5 year weekly chart is more of the same. Last weeks candle actual broke the 90 mark.

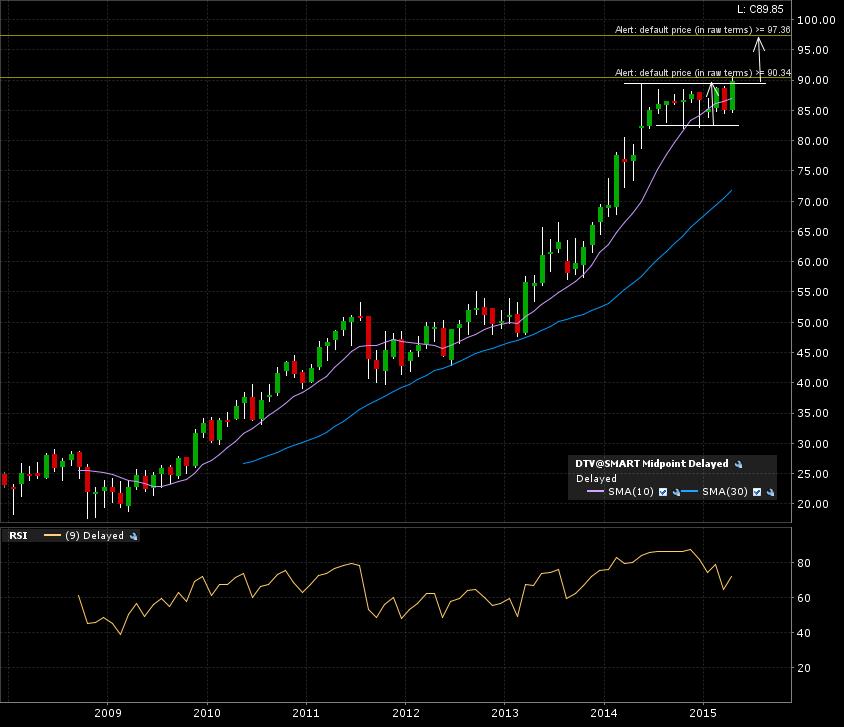
Zoom in on the 1 year daily candle chart. DTV has been consolidating in a sideways manner with a rectangle classical chart pattern. You can also see the price action gap up above the breakout line.

I will wait for a convincing monthly candle close above the breakout line before confirming the breakout. The implied measured move added to the breakout line would give a first target of 97.50. There is a provision for tight rectangles were the price varies 8-10% during the consolidation period. The ensuing target would be 3x the implied measured move, in this case giving a 112.50 target.