Exception to establishing targets based purely on classical charting principles, “WALLS”! I’ve been talking about “WALLS” in some previous posts, and thought it is time to give this important concept a full blog entry.
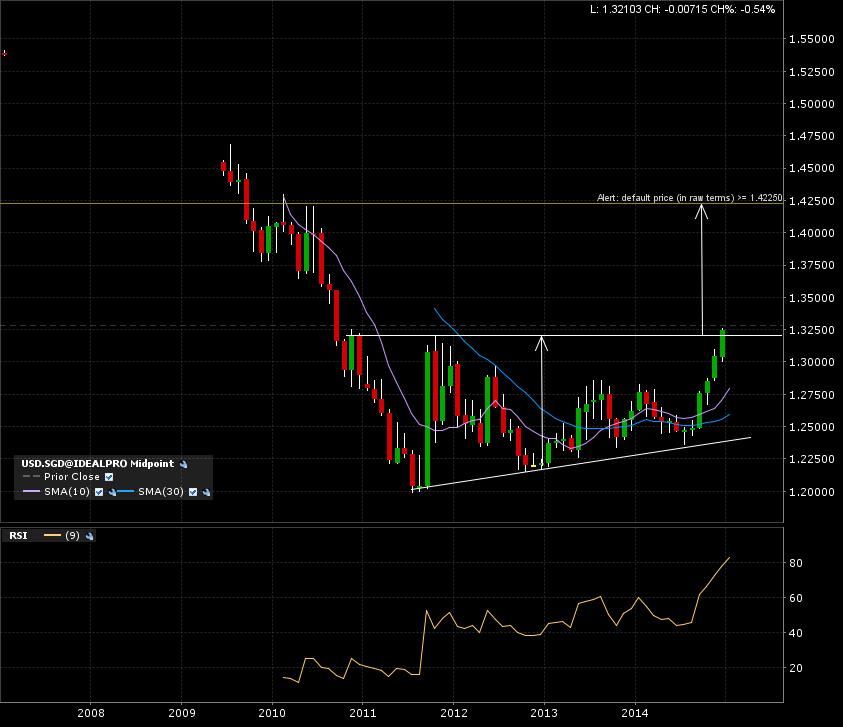
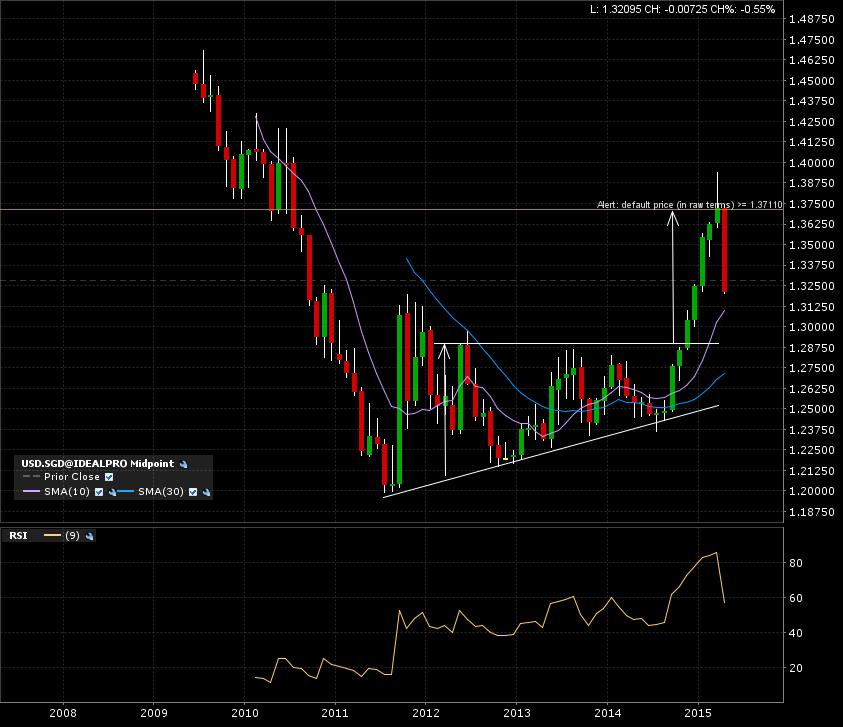
Enter US Dollar/Singapore Dollar to demonstrate on the monthly candle 10 year chart. Here is a first analysis I did with the price target shown with the arrow.
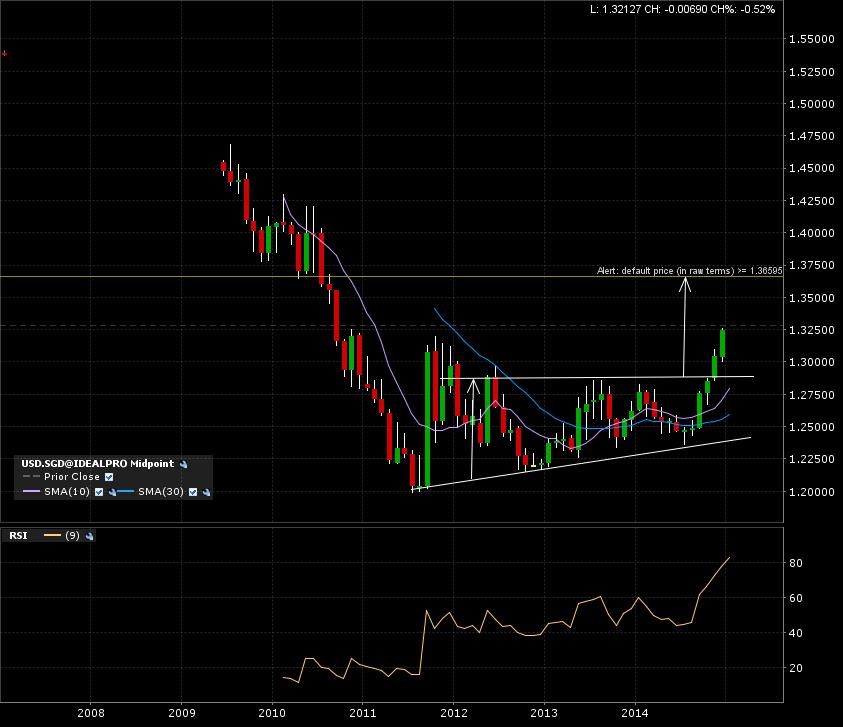
That looked pretty swell at that point. But wait, I just noticed a “WALL”. I consider a “WALL” to be a previous zone of important support turned resistance and vice-versa. Now check the updated analysis with the “WALL” consideration. The chart pattern is more closely outlined, giving a smaller implied measured move, with a closer target. The lowered target now coincides with the “WALL”. I now believe to be on the good side of the setup with this increase in probability of reaching my possible target.
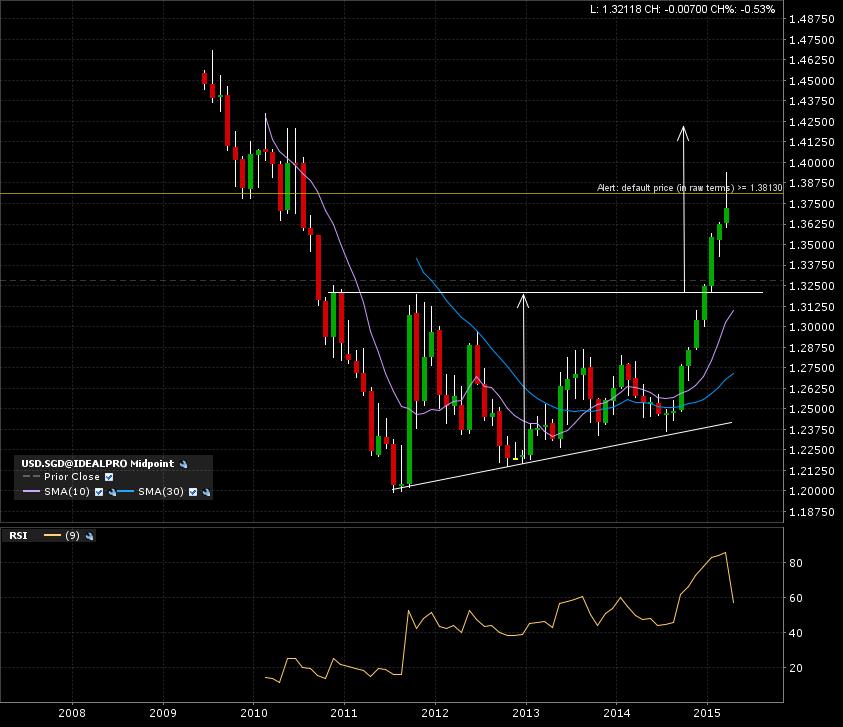
Alright, lets play out the graph and see what happened with the price action. Firstly with the original analysis, without the “WALL” consideration. Look at that candle just get refuted at the “WALL”. That support turned resistance gobbled up the bullish momentum at that point.
Now, here is with the new target due to the “WALL” consideration. Target reached, go profits go $$$!
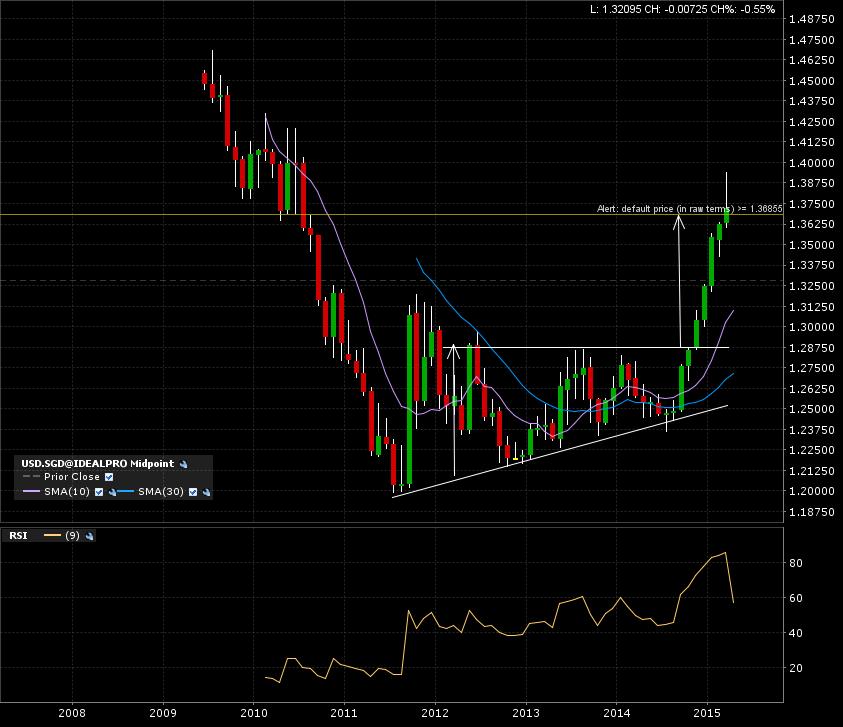
Finally, here is what happened this past month. The first target was never reached and a bearish pullback happened.
“WALLS” can be crushed, but most times multiple tests must occur before they break. I rather take my profits before, see what happens after, and re-enter if a classical chart pattern give me the skewed risk to reward ratio I’m looking for. Check my “How To” for more details.
Spotting “WALLS” on the way to the implied measured move is enough to re analyse the current chart. I don’t always correctly analyse a chart. My vision is sometimes skewed, thus a precious hint as an apparent “WALL” should ALWAYS be considered.