EMC Corporation (EMC:NYSE) is currently tracing out a BIG +3 year a bullish continuation “ascending triangle” classical chart pattern. Check out the 10 year monthly candle chart.

The 5 year weekly candle chart shows the bounce of the ascending lower boundary trend line. A break below that invalidates the current pattern. Morphing will occur and a new pattern will eventually emerge.
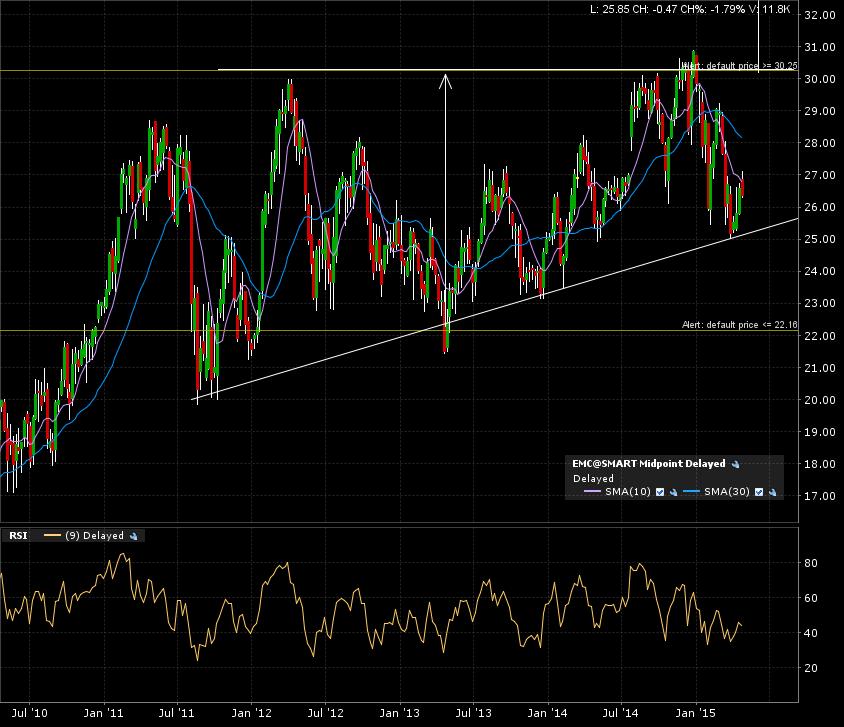
Zoom in on the 1 year daily candle chart. Price action bouncing off the support trend line.

My alerts are set. One on the breakout line at 30. A monthly close above that level will give me a target of 38. My second alert is in case of chart morphing and a possible bearish breakdown. That alert is at 22.