I used my way-back machine to September 2008 and saw how I would of played IBM (IBM:NYSE).
Here is the monthly candle chart with arrows indicating a previous target reached after a bullish breakout from a BIG +5 year base. A small top formation also has been forming for the past +4 months. An ascending trend line is also being traced and tested. I have an alert set at 100 which is the previous resistance (breakout line) turned support (breakdown line).
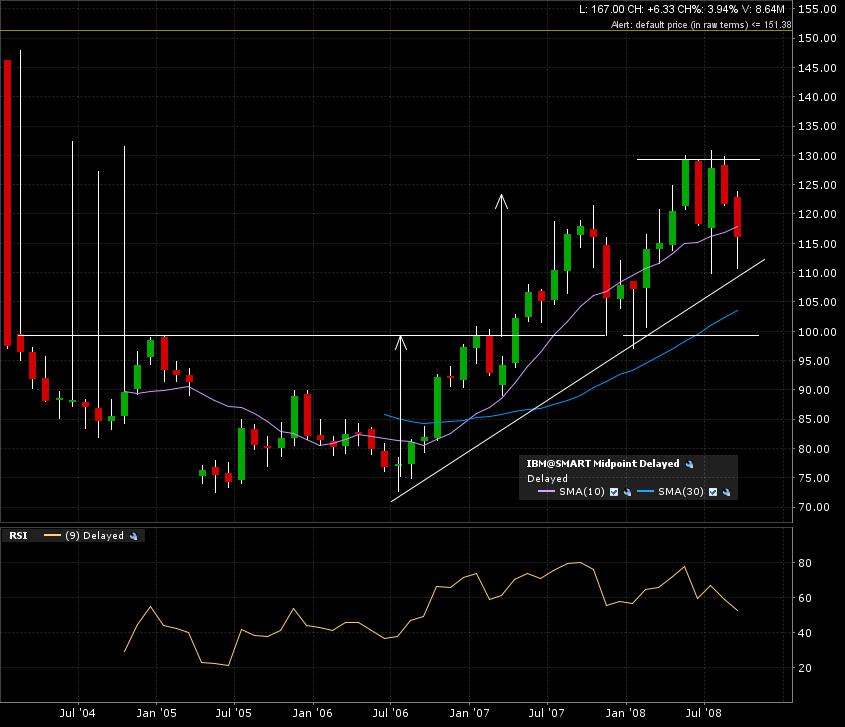
Fast forward 1 month to October 30th 2008. My alert was triggered during the month, but as I confirm breakdowns with a monthly candle close below it, I would still be on the side lines. Probably lots of noise on the daily and weekly candle charts. All I see on the monthly candle chart is a close below the breakout line of 100. This is my time to enter. Short at 93.15 (close of monthly candle). Implied measured move added to breakdown line gives a target of 71.

Fast forward another month. My profit-limit was hit sometime during the month of November. A +24 month top was needed to get a fast move to target in 1 month. The bigger the base…

Yes, I know, hind sight is 20/20 and this play could of ended up differently. I like to bring up examples like this to friends who say NOBODY could of seen the 2008 crash. Well, it’s one thing to see it or not, I couldn’t really care, the questions is, could I of played it? Answer is a DEFINATE YES!
I also don’t really care for the word crash or bull run, I just see classical chart patterns, entries and exits with possibly skewed risk to reward relationships giving me an edge in case my target aren’t reached. Time to check my “How To”.