Some time back (Jan 18) I had a look at Google. There was a potential breakdown on the monthly candle chart, but never confirmed.
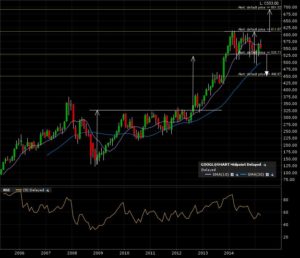
A monthly candle close below 525 was and still is required for the confirmation. Target that would ensue is 450. A bullish breakout would require a monthly candle close above 612 giving a target of 692.
Here are the ever morphing charts, starting with the 10 year monthly candle chart. The arrows indicate the implied measured move in case of breakdown OR breakout.
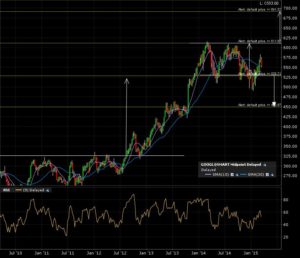
Some noise below the breakdown line (support) on the weekly candle chart (5 years). Whipsaw avoided using the noise reduction power of the monthly candle close.
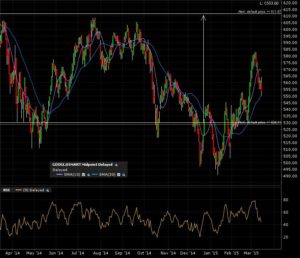
Lots of noise on the daily candle 1 year chart. Right now in no man’s land.
Google seems to be in a top consolidation pattern. I still have alerts for either bull OR bear case. Will come back after the next alert triggers.


