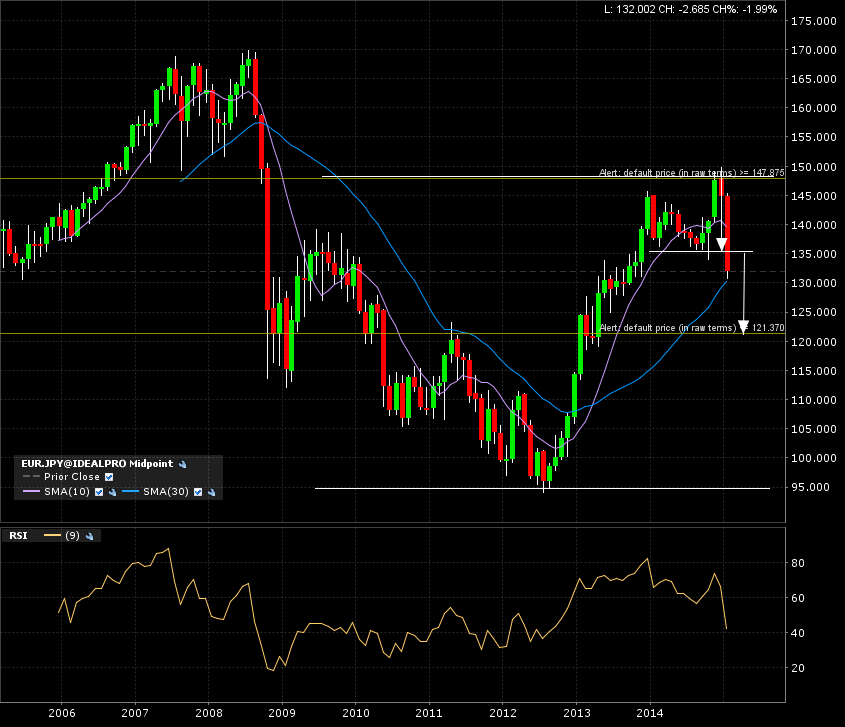
A 1 year top formation has been breached for the eurjpy currency pair. The implied measured move from this breakdown is shown with arrows on the monthly candle 10 year chart. A close of the current monthly candle below this level would confirm the move.
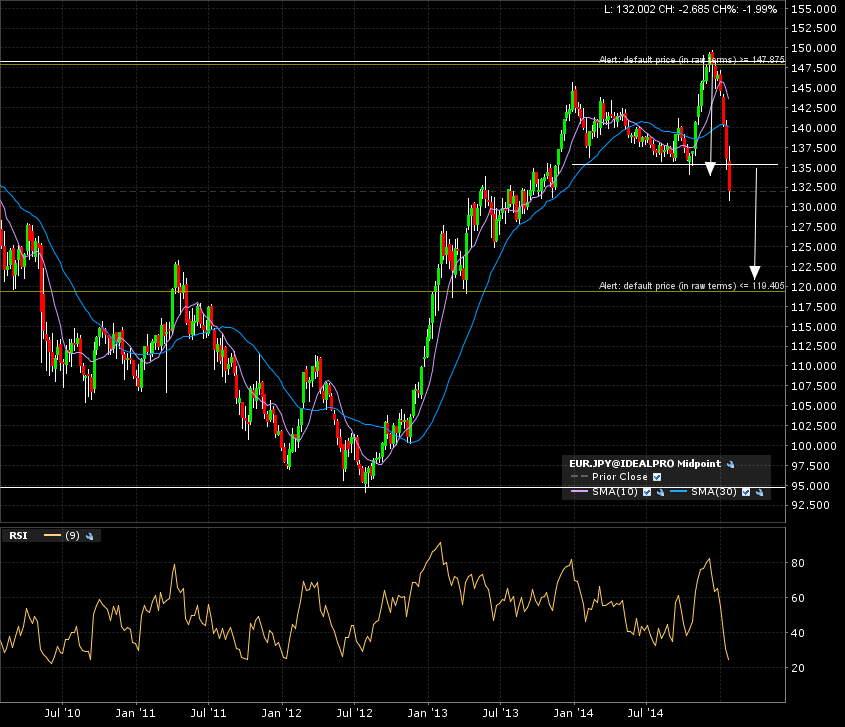
The weekly candle 5 year chart already has a weekly candle close below the break line at 1.35.
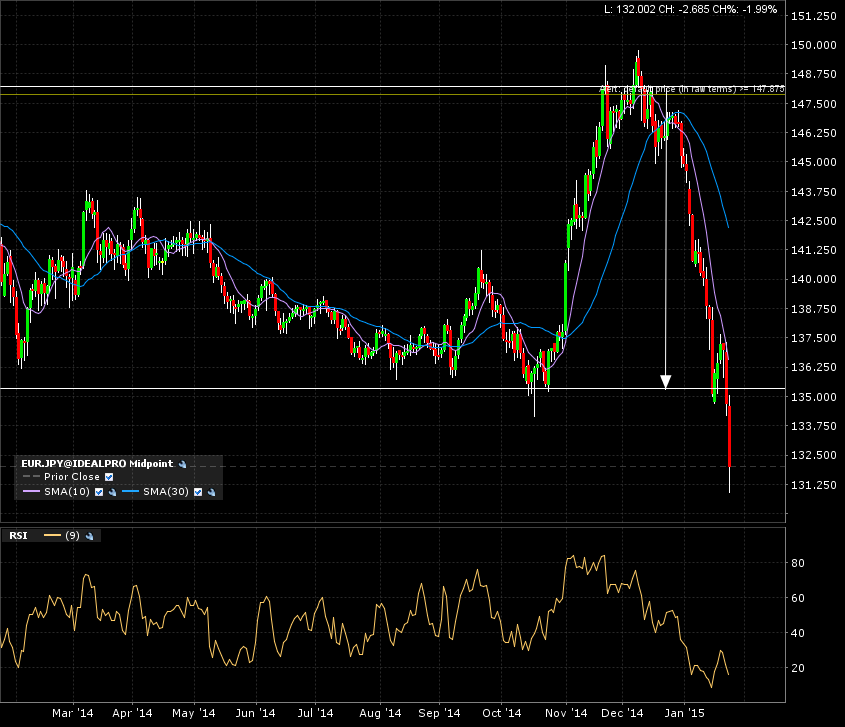
That was one hell of a bounce off the resistance at 1.50. The daily candle (1 year) chart shows this in detail.
The coast is now clear to target at 121, which coincides with previous resistance, which turned support. The daily and weekly charts have candles closing below the break line, now we only need to wait for the monthly candle to confirm.
We want to avoid whipsaws and the noise reduction power of the monthly candle is what we need.