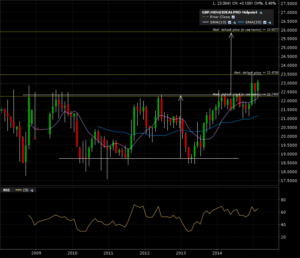
Look at this +7 year base breaking out on the monthly candle chart. After an initial breakout, a small consolidation formation just above the breakout line might finally resolve so the bullish target can be attained.
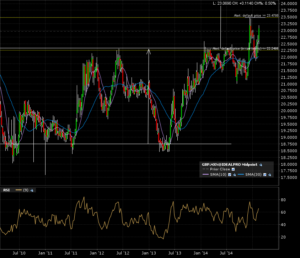
The weekly candle 5 year chart shows the current approach to the 23.50 mark. I’m looking for a close above this for confirmation.
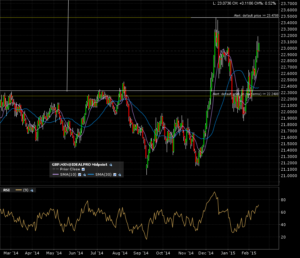
The zoom on the daily candle 1 year chart shows us the “noise” on the pullback below the breakout line. Had this been played on the daily candle chart, I might of been whipsawed.
My alert is set at 23.50. Those already in based on the monthly candle breakout will find some comfort after this congestion line is resolved.


