Check out the monthly candle chart (7 years). A HUGE + 4 year top formation has hit it’s bearish target early 2014.
After some consolidation (+1 year), there might be more pain for the Aussie inflicted by the Kiwi. The breakdown is in progress, but needs a convincing monthly candle close below the 1.0350 mark for confirmation.
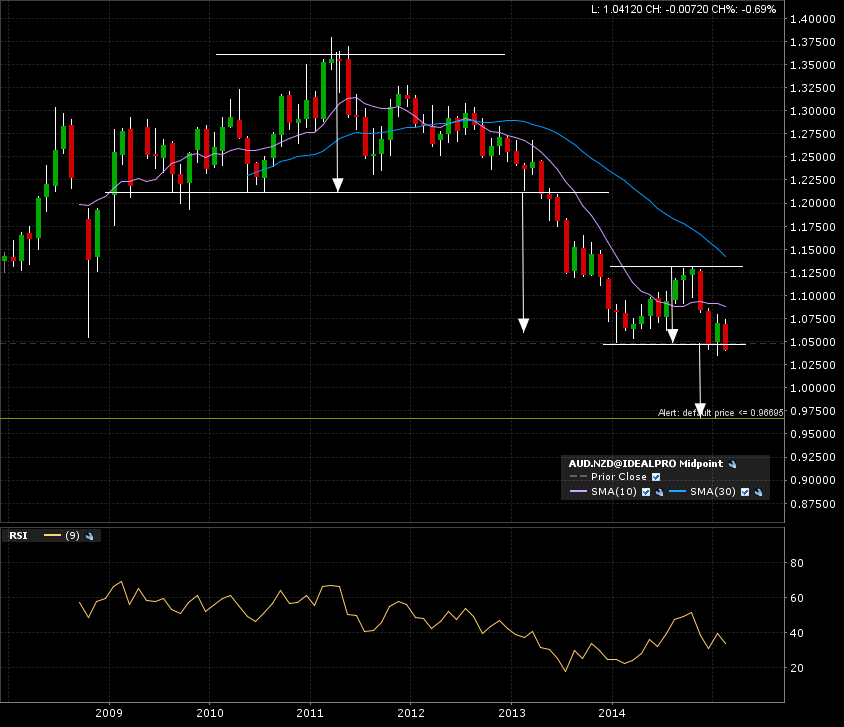
The arrows indicate the implied measured move from the classical chart formation applied to the breakout line.
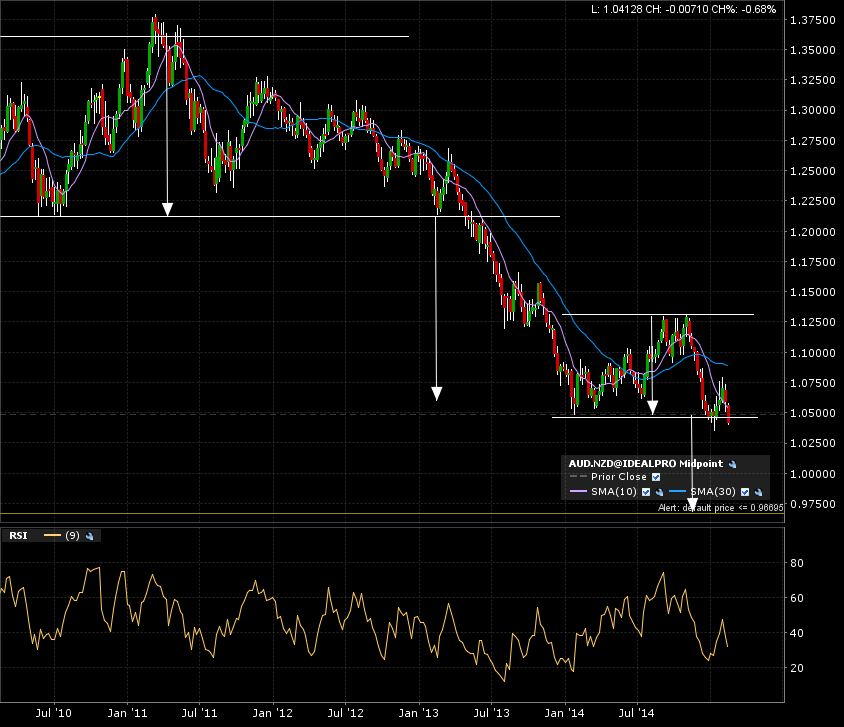
The weekly candle 5 year chart shows us the audnzd pair is testing this breakout line.
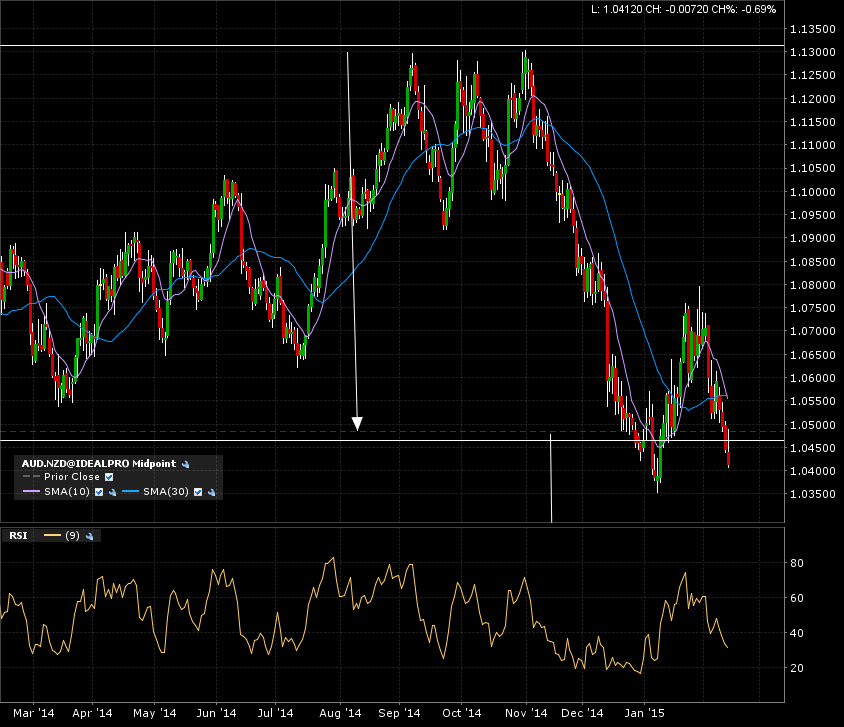
The 1 year daily candle chart shows us some previous noise below the breakout line. That is why we want a monthly close, to give more weight for that A+ breakdown setup.
Set an alert at the 1.0350 level. IF the monthly candle close below that level happens, the target is 0.9670.